
In July, Stouffville's sales-to-new-listings ratio hit 38.1%, the closest it had been to TRREB's 40% balanced line in at least a year and second in York Region behind Markham. Two months later it's at 36.3%. September's numbers explain why: 41 sales, down 28.1% from last September, the steepest decline of any market we cover. And unlike everywhere else in York Region, supply didn't shrink to offset it. New listings were up 1.8% from a year ago and active inventory was up 0.7%. Stouffville is the only one of our eight markets carrying more homes for sale than it was last September.
Prices followed. The average fell 8.7% to $1,139,770 and the median fell 8.3% to $1,050,000, both moving together, so this isn't a mix story. Detached, which is 63% of what sells here, repriced 8% on the average and almost 10% on the median across 26 sales. The homes that did sell went quickly, 35 days against 44 in August, and semis and townhouses closed above asking. Fewer buyers, but the ones who showed up were decisive. The GTA-wide picture is in our September 2026 Market Watch post. These figures cover TRREB's Whitchurch-Stouffville area.
How Did Stouffville Real Estate Change Year Over Year in September 2026?
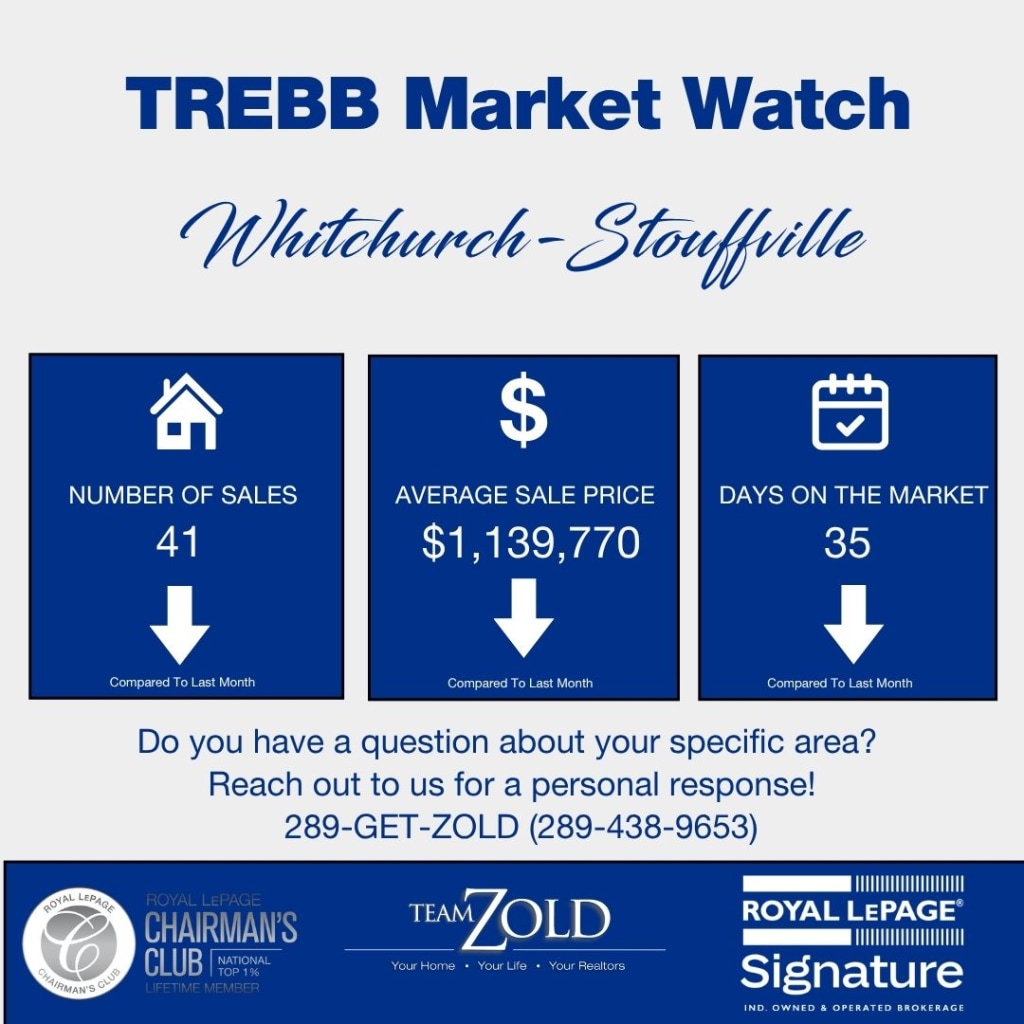
Stouffville recorded 41 sales in September 2026, down 28.1% from 57 in September 2025. The average price fell 8.7% to $1,139,770 and the median fell 8.3% to $1,050,000. New listings rose 1.8% to 166 and active inventory edged up 0.7% to 299. The SNLR rose 0.8 points to 36.3%, months of inventory ticked up from 5.1 to 5.2, the sale-to-list ratio held at 97%, and days on market fell from 39 to 35.
| Metric | September 2025 | September 2026 | Change |
|---|---|---|---|
| Total Sales | 57 | 41 | -28.1% |
| Average Price | $1,248,721 | $1,139,770 | -8.7% |
| Median Price | $1,145,000 | $1,050,000 | -8.3% |
| New Listings | 163 | 166 | +1.8% |
| SNLR | 35.5% | 36.3% | +0.8 pts |
| Active Listings | 297 | 299 | +0.7% |
| Months of Inventory | 5.1 | 5.2 | +0.1 |
| Sale-to-List Price Ratio | 97% | 97% | 0 pts |
| Avg Days on Market | 39 | 35 | -4 days |
Source: Toronto Regional Real Estate Board (TRREB) Market Watch, September 2026 and September 2025.
The average and median falling by almost the same amount makes September's price decline easy to read. Detached made up 63% of sales against 67% a year ago, a small shift, and the detached median itself fell 9.8%. The typical Stouffville home cost $95,000 less than last September, and the typical detached home cost about $129,000 less. That's a real move, and it happened in a month where the sellers who did close took 97% of asking, same as last year. Prices came down through list prices, not through deeper discounting.
At 97% on a $1,050,000 median, the gap between list and close is about $31,500. The homes that sold took 35 days, four fewer than last September and nine fewer than August. For a month with a 28% sales drop that's a strange pairing, and it tells you the September market split in two: homes priced to the new level sold quickly, and homes priced to the old level didn't sell at all. That second group is sitting in the 299 active listings.
The supply side went the other way
Every other York Region market we cover saw new listings fall or hold flat from last September, most by double digits. Stouffville's rose. Active inventory in the region fell 8.9%; Stouffville's rose 0.7%. That's the whole reason the SNLR, which had been climbing faster than almost anywhere in the region through July, has now given back 1.8 points in two months. The demand drop would have been absorbed by a shrinking supply, the way it was in Vaughan and Aurora. Stouffville's supply didn't shrink. Months of inventory moved up to 5.2, which puts Stouffville looser than Markham, Vaughan, Newmarket and Aurora this month.
What Happened by Property Type in Stouffville This September?
Detached homes did 26 sales at an average of $1,329,027, down 8.0% from last September, with the median down 9.8% to $1,190,000. Detached volume fell from 38 sales a year ago, and that drop accounts for most of the overall decline. Semi-detached did 5 sales at 102% of asking and freehold townhouses did 7 at 101%. Condo townhouses and condo apartments did 2 sales and 1 sale respectively.
Average Sold Price by Property Type
| Property Type | September 2025 | September 2026 | YoY Change | SP/LP |
|---|---|---|---|---|
| Detached (26 sales) | $1,444,289 | $1,329,027 | -8.0% | 96% |
| Semi-Detached (5 sales) | $1,022,650 | $873,778 | -14.6% | 102% |
| Freehold Townhouse (7 sales) | $898,816 | $838,857 | -6.7% | 101% |
| Condo Townhouse (2 sales) | $680,000 | $605,000 | -11.0% | 95% |
| Condo Apartment (1 sale) | $741,000 | $725,000 | -2.2% | 97% |
Source: TRREB Market Watch, September 2026 and September 2025. Sales counts are September 2026.
Median Sold Price by Property Type
| Property Type | September 2025 | September 2026 | YoY Change | SP/LP |
|---|---|---|---|---|
| Detached (26 sales) | $1,319,250 | $1,190,000 | -9.8% | 96% |
| Semi-Detached (5 sales) | $1,022,650 | $880,000 | -13.9% | 102% |
| Freehold Townhouse (7 sales) | $902,944 | $806,000 | -10.7% | 101% |
| Condo Townhouse (2 sales) | $680,000 | $605,000 | -11.0% | 95% |
| Condo Apartment (1 sale) | $824,000 | $725,000 | -12.0% | 97% |
Source: TRREB Market Watch, September 2026 and September 2025. Sales counts are September 2026.
Detached is the Stouffville market, and 26 sales is a workable sample for a town this size. The average and median both fell between 8% and 10%, moving together, which means the decline runs across the detached range rather than sitting at one end. Those homes closed at 96% of asking in 39 days, four days faster than last September. A year ago the detached median was $1,319,250. Now it's $1,190,000. If you own a detached home in Stouffville, that's the number to price against, and it's been drifting lower since the spring.
The townhouse and semi lines are small but they point the same direction. Freehold townhouses did 7 sales at 101% of asking in 21 days, the fastest segment in Stouffville, with the median down 10.7% to $806,000. Semis did 5 sales at 102% of asking in 25 days. Both segments repriced from last year and both are now clearing above list. That's the pattern across York Region in the segments below detached: the price reset happened on the list side, and buyers are competing again at the new numbers.
Condo townhouses did 2 sales and condo apartments did 1. The percentages next to those lines are arithmetic, not information. Stouffville's condo market is small enough that a single building's turnover decides the month, and I wouldn't price or bid off these figures.
What Has Stouffville Real Estate Done Over the Past 12 Months?
The average price has ranged from $1,125,840 in July to $1,586,674 in December 2025, a month skewed by a handful of large estate sales, and September's $1,139,770 is the second-lowest reading in the window. Sales bottomed at 21 in January and peaked at 57 in May. The SNLR climbed from 33.8% in January to 38.1% in July, then slipped to 37.5% in August and 36.3% in September. Months of inventory fell from 5.3 to 4.8 in June and have risen back to 5.2.
| Month | Average Price | Sales | SNLR | MOI |
|---|---|---|---|---|
| September 2026 | $1,139,770 | 41 | 36.3% | 5.2 |
| August 2026 | $1,158,512 | 47 | 37.5% | 5.0 |
| July 2026 | $1,125,840 | 49 | 38.1% | 4.9 |
| June 2026 | $1,329,155 | 54 | 38.0% | 4.8 |
| May 2026 | $1,220,389 | 57 | 36.7% | 4.9 |
| April 2026 | $1,186,821 | 48 | 35.6% | 5.1 |
| March 2026 | $1,248,851 | 46 | 35.1% | 5.2 |
| February 2026 | $1,156,315 | 33 | 34.6% | 5.3 |
| January 2026 | $1,293,352 | 21 | 33.8% | 5.3 |
| December 2025 | $1,586,674 | 43 | 35.0% | 5.2 |
| November 2025 | $1,206,416 | 56 | 34.8% | 5.2 |
| October 2025 | $1,288,264 | 55 | 35.1% | 5.1 |
Source: TRREB Market Watch, October 2025 through September 2026.
Through July, Stouffville was one of the better stories in York Region: a 4.3-point SNLR climb in six months, months of inventory falling under five, sales holding in the high 40s and 50s. The past two months have reversed a chunk of that. The ratio has dropped 1.8 points, months of inventory have added four tenths, and September's 41 sales is the lowest count since February. None of those moves is large on its own. Together they say the tightening Stouffville had going in the first half of the year has stalled.
The price column has been volatile all year because of volume. December's $1,586,674 came from a 43-sale month with an unusually heavy top end; July's $1,125,840 was the low. Ignore the extremes and the average has mostly sat between $1,125,000 and $1,330,000, with September near the bottom of that range. The sale-to-list ratio has held between 96% and 99% in eleven of the twelve months, so the negotiating room on a typical home has stayed near 3% throughout. What's changed is the direction of inventory, and that's the thing to watch into the winter.
How Did Stouffville's September Compare to August 2026?
Sales fell 12.8% from August's 47 to 41. The average price slipped 1.6% to $1,139,770 while the median rose 3.5% to $1,050,000. New listings jumped 35.0% to 166 and active inventory rose 3.8% to 299. The SNLR fell 1.2 points to 36.3%, months of inventory rose from 5.0 to 5.2, the sale-to-list ratio improved a point to 97%, and days on market dropped nine days to 35.
| Metric | August 2026 | September 2026 | Change |
|---|---|---|---|
| Total Sales | 47 | 41 | -12.8% |
| Average Price | $1,158,512 | $1,139,770 | -1.6% |
| Median Price | $1,014,250 | $1,050,000 | +3.5% |
| New Listings | 123 | 166 | +35.0% |
| SNLR | 37.5% | 36.3% | -1.2 pts |
| Active Listings | 288 | 299 | +3.8% |
| Months of Inventory | 5.0 | 5.2 | +0.2 |
| Sale-to-List Price Ratio | 96% | 97% | +1 pt |
| Avg Days on Market | 44 | 35 | -9 days |
Source: TRREB Market Watch, September 2026 and August 2026.
The month-over-month table is less alarming than the year-over-year one. Prices were roughly flat against August, the median actually rose, the ratio improved and homes sold faster. The problem is on the volume and supply lines: sales fell 13% while listings rose 35%, and that combination pushed the ratio down 1.2 points in a single month, the largest monthly drop of any York Region municipality in September.
Active inventory rose by 11 homes, which is modest, so the listing wave hasn't piled up yet. Whether October's buyers work through the 166 new listings or let them accumulate is what decides Stouffville's winter.
What This Means Heading into October 2026
What should Stouffville sellers do right now?
You're selling into the one York Region market where supply didn't tighten this year, and that changes the math. Buyers have 299 homes to choose from, more than last September, and they bought 41 of them. The homes that sold were priced to September's comparables: a detached median of $1,190,000, about 10% below last fall, closing at 96% of asking. If you price a detached home in Stouffville to what the same house fetched in the spring, you'll be competing with the listings that have already been sitting through two months of slipping demand. If you price it to the past 60 days, you'll sell in about five weeks, and in the townhouse and semi segments you may get more than asking. The towns and semis that sold in September went above list. The detached homes that sold went at 96%. The ones that didn't sell at all were priced for a market that ended in July.
Is this a good time to buy in Stouffville?
Stouffville has quietly become one of the better buyer's markets among the York Region towns. The median is $95,000 below last September, the detached median is down about $129,000, inventory is higher than a year ago at 299 homes, and months of inventory at 5.2 gives you more selection relative to demand than Markham, Vaughan, Newmarket or Aurora. A conditional offer with an inspection and a financing clause is normal here, and 35 days on market means you're not racing. Two things to be clear-eyed about. The townhouse and semi segments are tight and closing above asking, so your room to negotiate is in detached. And a ratio that moved from 38.1% to 36.3% in two months can move back just as quickly in a market where ten sales is a 25% swing. If a detached home in Stouffville works for you at today's numbers, it's a good moment.
What to watch in October 2026
First, whether the SNLR stabilizes. Two monthly drops took it from 38.1% to 36.3%. A third in October would confirm Stouffville has loosened for the winter. A flat or rising reading would mean the September listing wave got absorbed. Second, active inventory against last October's 275. September's 299 is already above that, and if October adds to it, Stouffville will carry more supply into the winter than at any point in the past year. Third, the detached median. At $1,190,000 it's down 9.8% year over year, and whether October holds that level or slips further tells you whether the detached reset is finished.
Thinking About Making a Move in Stouffville?
Whether you're in the Main Street core, Ballantrae, Musselman's Lake or anywhere else in Whitchurch-Stouffville, our team watches these numbers street by street and can tell you what a month like this one means for your specific home or your search.