
By Shawn Zigelstein, Broker, Team Zold
Stouffville's sales-to-new-listings ratio hit 38.1% in July, second in all of York Region behind only Markham, and its median price came in 3.3% higher than a year ago while nearly every market around it posted declines. Those are the headlines. Underneath them is a detached segment that quietly repriced by double digits, and the gap between those two stories is exactly the kind of thing a town-wide number will hide from you. So let's take Stouffville apart properly.
How Did Stouffville Real Estate Change Year Over Year in July 2026?
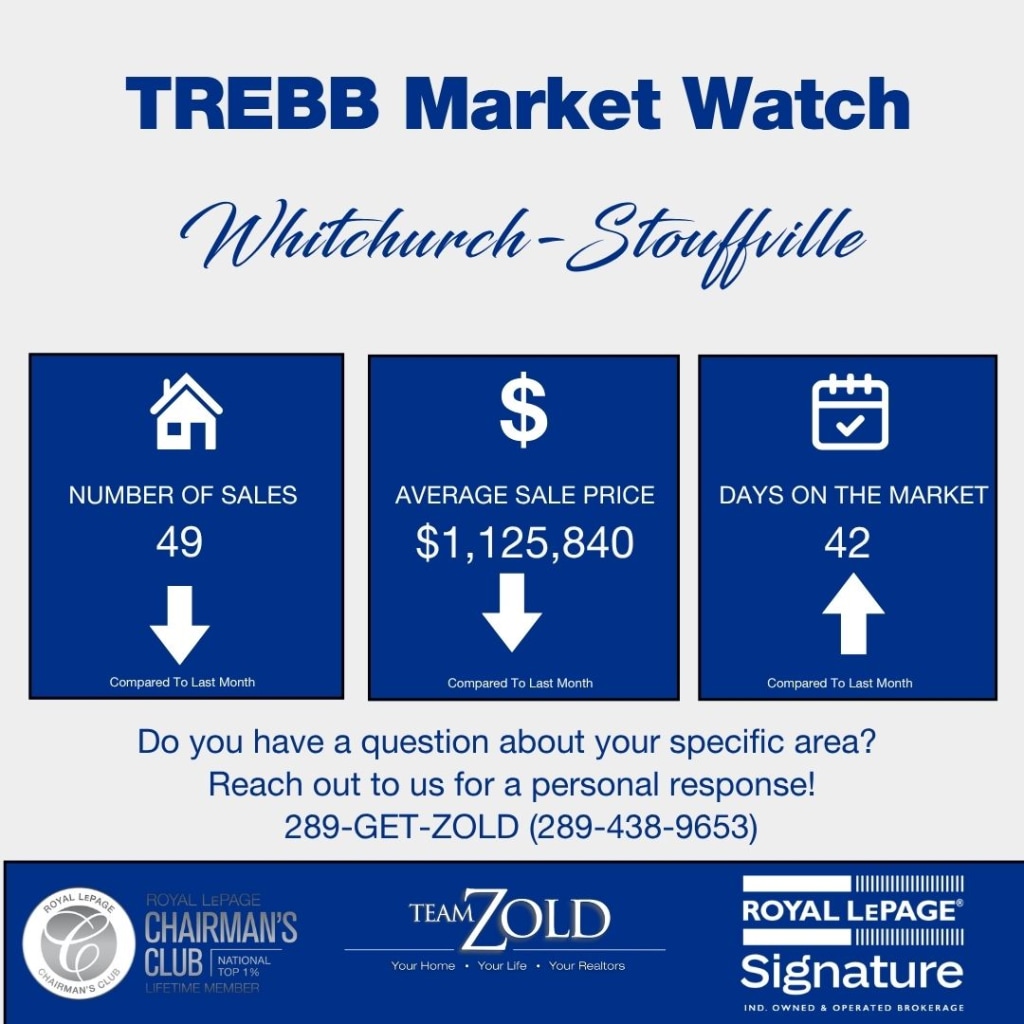
Whitchurch-Stouffville recorded 49 sales in July 2026, down 16.9% from 59 in July 2025. The average price slipped 2.6% to $1,125,840 while the median rose 3.3% to $1,088,000. New listings fell 19.1% to 140 and active inventory came down 7.7% to 298, pushing the SNLR from 33.4% up to 38.1%, a 4.7-point jump and the second-highest reading in York Region. Homes took 42 days to sell, ten days longer than a year ago.
Here is the full year-over-year picture.
| Metric | July 2025 | July 2026 | Change |
|---|---|---|---|
| Average Price | $1,155,795 | $1,125,840 | -2.6% |
| Median Price | $1,053,000 | $1,088,000 | +3.3% |
| Total Sales | 59 | 49 | -16.9% |
| New Listings | 173 | 140 | -19.1% |
| Active Listings | 323 | 298 | -7.7% |
| SNLR | 33.4% | 38.1% | +4.7 pts |
| Average Days on Market | 32 | 42 | +10 days |
| SP/LP | 97% | 97% | 0 |
Source: TRREB Market Watch, July 2026 and July 2025
Now, about that rising median, because I want you to understand it rather than just enjoy it. This July, detached homes made up 38 of Stouffville's 49 sales, almost 78%. Last July they were 59% of the mix. When the most expensive property type takes a much bigger share of a small market's sales, the town-wide median gets pulled upward no matter what individual homes are doing. And what detached homes were actually doing, as you will see in the segment tables below, was selling for about 11% less than a year ago. So the honest read is the opposite of the headline: the median is up because of what sold, not because homes are worth more. This is the same average-versus-mix lesson I teach in every small market, and Stouffville at 49 sales a month is exactly where it matters most.
The demand-side signal is real, though. A 4.7-point SNLR jump, built on sellers pulling back 19% while buyers only eased off modestly, is the biggest tightening move among the region's major markets this July. Stouffville now sits closer to TRREB's 40% balanced-market line than everyone except Markham. The 42 days on market cuts the other way, slowest of the region's mid-sized markets and ten days slower than last year, which usually means asking prices have not yet caught up to where buyers are actually transacting. Tight ratio, slow clock: a market still negotiating with itself.
What Happened by Property Type in Stouffville This July?
Detached homes were nearly the entire market at 38 of 49 sales, averaging $1,207,658, down 12.9% from last July, with the median down 11.5% to $1,180,000. Freehold townhouses did 9 sales at an average of $842,572 and closed at 100% of asking. The condo segments barely traded at all: one semi, zero condo townhouses, one condo apartment.
Average Sold Price by Property Type
| Property Type | July 2025 | July 2026 | Change |
|---|---|---|---|
| Detached (38 sales) | $1,386,957 | $1,207,658 | -12.9% |
| Semi-Detached (1 sale) | $928,333 | $862,000 | -7.1% |
| Freehold Townhouse (9 sales) | $888,350 | $842,572 | -5.2% |
| Condo Townhouse (0 sales) | $630,375 | — | n/a |
| Condo Apartment (1 sale) | $635,000 | $830,000 | +30.7% |
Source: TRREB Market Watch, July 2026
Median Sold Price by Property Type
| Property Type | July 2025 | July 2026 | Change |
|---|---|---|---|
| Detached (38 sales) | $1,333,000 | $1,180,000 | -11.5% |
| Semi-Detached (1 sale) | $965,000 | $862,000 | -10.7% |
| Freehold Townhouse (9 sales) | $864,000 | $830,750 | -3.8% |
| Condo Townhouse (0 sales) | $659,500 | — | n/a |
| Condo Apartment (1 sale) | $595,000 | $830,000 | +39.5% |
Source: TRREB Market Watch, July 2026
The detached numbers are the real Stouffville story this month, and they deserve a plain reading: down 12.9% on the average, down 11.5% on the median, on healthy volume of 38 sales against 35 last July. When both yardsticks fall together like that, it is not an outlier problem; the segment repriced. Two softeners before anyone panics. First, last July's detached prints, a $1,386,957 average over a $1,333,000 median, were themselves elevated for this market, so part of the drop is a rich comparison month washing out. Second, 47 days on market with a 97% close ratio says buyers are paying near asking once sellers set a realistic number; the fight is happening on the list price, not at the offer table.
Freehold townhouses are the segment doing quiet, tidy business: 9 sales at 100% of asking, 24 days, average of $842,572. This is Stouffville's entry-level freehold product, and it clears the moment it is priced sensibly, the same pattern as every market in the region. The one-sale semi and condo apartment rows and the zero-sale condo townhouse row are listed for completeness, not analysis. In a township this size, those segments produce statistics only a few months a year, and I would not read anything into any of them.
What Has Stouffville Real Estate Done Over the Past 12 Months?
Stouffville's average price swung from $1,586,674 last December to $1,125,840 this July, a $460,000 range that says more about monthly mix than about values. The steadier columns tell the story: sales have held between 43 and 64 in every month except a 21-sale January and a 33-sale February, the SNLR has climbed from the mid-33s to 38.1%, and months of inventory has drifted down from the low 5s to 4.9.
| Month | Average Price | Sales | SNLR | MOI |
|---|---|---|---|---|
| July 2026 | $1,125,840 | 49 | 38.1% | 4.9 |
| June 2026 | $1,329,155 | 54 | 38.0% | 4.8 |
| May 2026 | $1,220,389 | 57 | 36.7% | 4.9 |
| April 2026 | $1,186,821 | 48 | 35.6% | 5.1 |
| March 2026 | $1,248,851 | 46 | 35.1% | 5.2 |
| February 2026 | $1,156,315 | 33 | 34.6% | 5.3 |
| January 2026 | $1,293,352 | 21 | 33.8% | 5.3 |
| December 2025 | $1,586,674 | 43 | 35.0% | 5.2 |
| November 2025 | $1,206,416 | 56 | 34.8% | 5.2 |
| October 2025 | $1,288,264 | 55 | 35.1% | 5.1 |
| September 2025 | $1,248,721 | 57 | 35.5% | 5.1 |
| August 2025 | $1,223,606 | 64 | 34.7% | 5.2 |
Source: TRREB Market Watch, August 2025 through July 2026
Ignore the price column in this table, seriously. Any market where December can print $1.59 million, and July can print $1.13 million is a market whose monthly average rides on whether three estate properties or three townhouses closed that week. The SNLR column is where Stouffville's actual trend lives: 33.8% in January, then a steady grind up through the spring, 35.6%, 36.7%, 38.0%, and now 38.1%. That is one of the most consistent tightening lines in York Region, and it happened while total inventory barely moved, because sellers kept thinning out the new supply at the same time.
The sale-to-list ratio has spent all but one month of the year between 96% and 99%, and days on market have bounced between 24 and 44 without settling. Put the whole table together, and you get a market that is structurally tight, transactionally slow, and statistically noisy. The trend is toward balance. The month-to-month numbers will keep jumping around on the way there, and I will keep telling you which jumps matter.
How Did Stouffville's July Compare to June 2026?
Sales eased 9.3% from June's 54, one of the mildest summer step-downs in the region, while new listings fell 17.6% to 140. The average dropped 15.3% from June's mix-inflated $1,329,155, and the median came down 5.8% to $1,088,000. The SNLR held at 38.1%, and days on market stretched sharply, from 24 to 42.
| Metric | June 2026 | July 2026 | Change |
|---|---|---|---|
| Average Price | $1,329,155 | $1,125,840 | -15.3% |
| Median Price | $1,155,000 | $1,088,000 | -5.8% |
| Total Sales | 54 | 49 | -9.3% |
| New Listings | 170 | 140 | -17.6% |
| Active Listings | 299 | 298 | -0.3% |
| SNLR | 38.0% | 38.1% | +0.1 pts |
| Average Days on Market | 24 | 42 | +18 days |
| SP/LP | 97% | 97% | 0 |
Source: TRREB Market Watch, July 2026 and June 2026
That 15.3% monthly average drop is the mix machine running in reverse. June's $1,329,155 was itself a mix-driven spike for a 54-sale market; July's blend normalized, and the town-wide number gave the gain right back. Two numbers in this table are worth actual attention: sales holding within 9% of June, while the region fell 17.5%, says Stouffville's demand carried into the summer better than most. And new listings falling 18% month over month is the same seller pullback running through the whole region, which in a market already at a 38.1% SNLR is how balance arrives ahead of schedule.
What This Means Heading into August 2026
For Sellers in Stouffville
You have the second-tightest market in York Region and 19% less competition than last summer, and if you own entry-level freehold, townhouses are closing at full asking in three and a half weeks. The catch is the detached market, where the data is blunt: buyers are transacting about 11% below last year's levels, and the 42-day town-wide clock is mostly detached sellers discovering that one price cut at a time. Skip the discovery process. Price to the last ninety days of detached closings, and you will meet a market that, at 38.1% SNLR, has plenty of buyers left in it.
Is This a Good Time to Buy in Stouffville?
For detached buyers, quietly, yes, and more than the headline suggests. The typical detached home is $153,000 cheaper than it was last July; you have 42 days of market pace to work with, and sellers here have not yet fully adjusted their asking prices, which means motivated ones will negotiate. Stouffville also remains the play for space: a $1,180,000 detached median buys land and square footage here that costs $1.4 million in Markham or Richmond Hill. Move quickly only if you need a townhouse; that segment trades at full ask and does not wait. And know the clock: at 38.1% and climbing, Stouffville is likely to be one of the first York Region markets to reach balance, at which point this negotiating room starts disappearing.
What to Watch in August 2026
First, the 40% line. Stouffville sits 1.9 points from a balanced market, closer than anyone but Markham, and it has added almost five points of SNLR in a year. Cross it, and this becomes the region's first seller-tilting market of the cycle. Second, the detached list prices: if days on market come down from 42 toward 30 in the fall, sellers have adjusted, and the window I just described is closing. Third, listings: a township this size lives and dies on a handful of new listings a week, and if the fall flow stays 19% below last year, tight becomes tighter in a hurry.