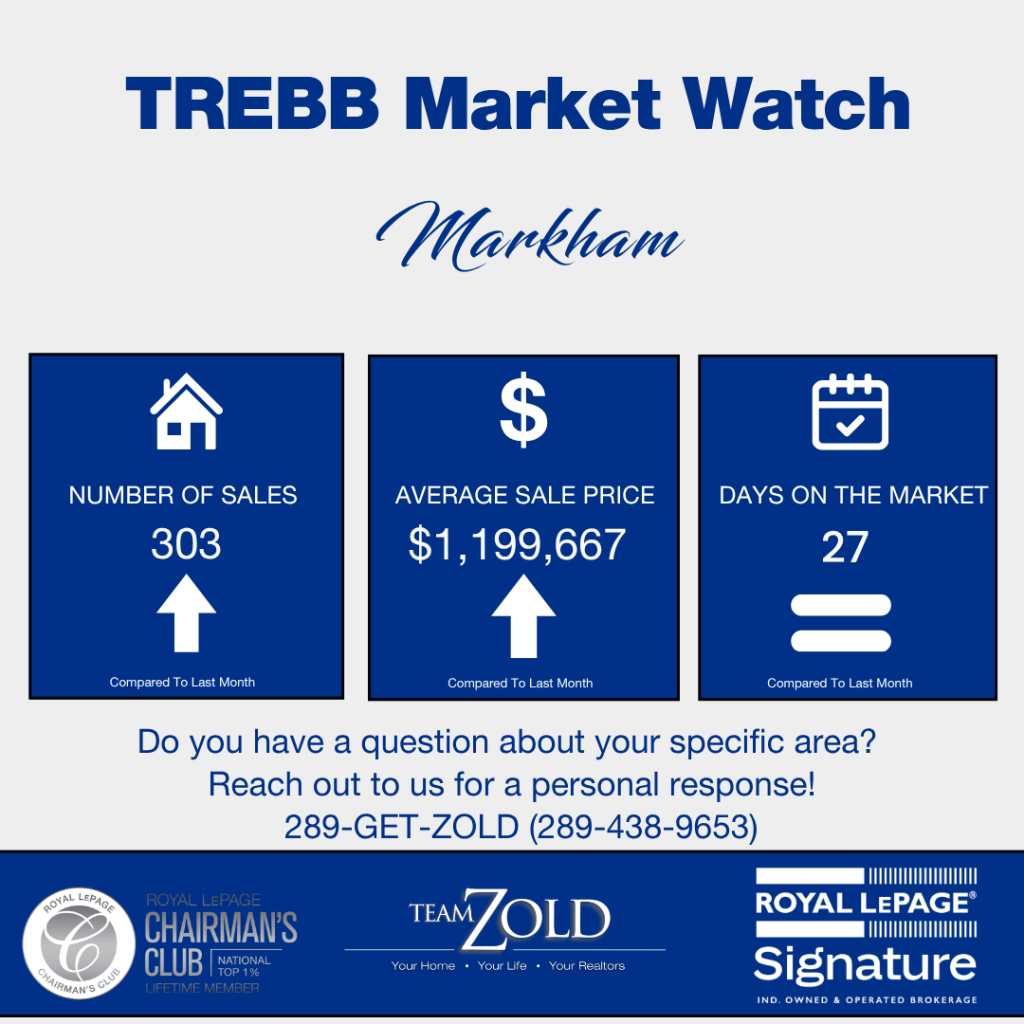
May was Markham’s busiest month in over a year, with 303 sales more than any month in the past twelve. More notable than the sales figure was the shift in supply: new listings fell 21% year over year. The market has moved from excess inventory to a shrinking supply. For the first time since last June, the average price increased month over month. While average prices remain about 6% lower year over year, the trend is now upward. Let’s examine the details.
How Did The Markham Real Estate Market Change Over The Past Year?
In May 2026, Markham recorded 303 home sales, up 18.4% from May 2025, while the average sale price came in at $1,199,667 (down 6.2% year over year) and the median landed at $1,160,000 (down 5.7%). New listings plunged 20.6% and active inventory dropped 11.1%, pushing the SNLR from 36.1% to 37.4%.
Here is the full year-over-year comparison.
| Metric | May 2025 | May 2026 | Change |
|---|---|---|---|
| Average Price | $1,279,253 | $1,199,667 | -6.2% |
| Median Price | $1,230,000 | $1,160,000 | -5.7% |
| Total Sales | 256 | 303 | +18.4% |
| New Listings | 948 | 753 | -20.6% |
| Active Listings | 1,311 | 1,166 | -11.1% |
| SNLR | 36.1% | 37.4% | +1.3 pts |
| Average Days on Market | 25 | 27 | +2 days |
| SP/LP | 100% | 99% | -1 pt |
Source: TRREB Market Watch, May 2026
Three key points stand out in the year-over-year data.
First, the decline in supply is significant. New listings dropped from 948 to 753, a 21% decrease, and active listings fell from 1,311 to 1,166. Increased buyer demand met with fewer options, creating real market movement. An 18% increase in sales alongside a 21% drop in listings marks a notable shift.
Second, the gap between average and median prices narrowed to $40,000 from $57,000 in April. This indicates that high-end sales are having less impact on the average, and transactions are more evenly distributed across price points.
Third, the sale-to-list price ratio (SP/LP) declined from 100% to 99%, providing about $12,000 in negotiating room on a $1.2 million home. This is less than the 98% seen in March and April, indicating that room for negotiation is decreasing.
What Happened by Property Type in Markham This May?
Detached homes led with 148 sales, a 20% year-over-year increase, though the average price declined 7.8% to $1,552,562. Freehold townhouse sales rose 53%. Notably, semi-detached and freehold townhouses are now selling above asking price, with SP/LP ratios of 104% and 101%, respectively.
Average Sold Price by Property Type
| Property Type | May 2025 | May 2026 | Change |
|---|---|---|---|
| Detached | $1,683,816 | $1,552,562 | -7.8% |
| Semi-Detached (20 sales) | $1,162,605 | $1,085,768 | -6.6% |
| Freehold Townhouse | $1,149,520 | $1,039,913 | -9.5% |
| Condo Townhouse (24 sales) | $760,253 | $734,571 | -3.4% |
| Condo Apartment | $671,874 | $617,507 | -8.1% |
Source: TRREB Market Watch, May 2026
Median Sold Price by Property Type
| Property Type | May 2025 | May 2026 | Change |
|---|---|---|---|
| Detached | $1,505,000 | $1,456,500 | -3.2% |
| Semi-Detached (20 sales) | $1,157,500 | $1,081,500 | -6.6% |
| Freehold Townhouse | $1,185,000 | $1,030,900 | -13.0% |
| Condo Townhouse (24 sales) | $772,000 | $750,000 | -2.8% |
| Condo Apartment | $650,000 | $556,500 | -14.4% |
Source: TRREB Market Watch, May 2026
Detached homes show a different trend from April. The average price is down 7.8% year over year, while the median is down only 3.2%. In April, both were down over 10%. This narrowing suggests typical detached buyers are paying prices similar to last year, while the high-end segment has softened. Buyers in the $1.3 to $1.5 million range will find prices more stable than the average suggests.
Freehold townhouses and semi-detached homes are experiencing the most activity. Freehold townhouse sales increased from 34 to 52, with an SP/LP ratio of 101%. Semi-detached homes reached 104%. The above-asking results indicate that, for the first time in this cycle, some segments are seeing multiple offers drive prices above list. The mid-market is tightening first, as these price points attract the most buyers and feel supply constraints earliest.
Condo apartment sales declined 15% (from 59 to 50), and the median price fell 14.4%, marking the largest median decrease among all segments. Condos remain the softest segment in Markham, though the SP/LP ratio increased to 100% from 99% last year. Buyers continue to negotiate, but with less flexibility than before.
Note on volumes: Semi-detached sales at 20 and condo townhouse sales at 24 are improvements over April’s 14 and 9, but these numbers remain low. It is best to assess these trends over several months rather than relying on a single month’s data.
Markham Market Trends Over The Past 12 Months
Markham's average price peaked at $1,286,057 in June 2025, bottomed at $1,068,928 in February 2026, and has climbed back to $1,199,667 in May — the highest average since October 2025. The sale-to-list ratio has been below 100% every month from June 2025 through May 2026, a twelve-month stretch of negotiating room, but it is trending back toward 100%.
| Month | Average Price | Sales | SNLR | MOI |
|---|---|---|---|---|
| May 2026 | $1,199,667 | 303 | 37.4% | 4.5 |
| April 2026 | $1,140,668 | 250 | 35.9% | 4.6 |
| March 2026 | $1,155,505 | 225 | 35.7% | 4.7 |
| February 2026 | $1,068,928 | 182 | 35.2% | 4.7 |
| January 2026 | $1,100,945 | 163 | 34.5% | 4.7 |
| December 2025 | $1,187,221 | 171 | 34.5% | 4.7 |
| November 2025 | $1,149,893 | 219 | 34.9% | 4.6 |
| October 2025 | $1,230,833 | 281 | 35.5% | 4.4 |
| September 2025 | $1,177,290 | 259 | 35.9% | 4.3 |
| August 2025 | $1,136,323 | 240 | 35.6% | 4.3 |
| July 2025 | $1,246,087 | 266 | 35.8% | 4.2 |
| June 2025 | $1,286,057 | 274 | 35.8% | 4.1 |
Source: TRREB Market Watch, June 2025 through May 2026
Two things stand out across the 12 months.
The average price pattern looks like a U. It peaked last June at $ 1,286,05. The average price trend forms a U-shape: peaking at $1,286,057 last June, declining through winter, bottoming at $1,068,928 in February, and rising in three of the past four months. May’s $1,199,667 is the highest since October’s $1,230,833. While a single month’s increase may be insignificant, three out of four months of growth suggest a meaningful trend. Whether prices continue to rise will depend on future supply levels. The months, MOI has dropped to 4.5 in May.
That is still solidly in buyer's market territory — anything above 4 months generally favours buyers — but the direction is down. In our April article, we said to watch whether monthly sales consistently pushed above 280. May hit 303. That condition is being met. Active listings are still well above the 800 level we flagged as a tightening trigger, but they are coming down. If sales stay above 280 per month and new listings continue to decline as they did in May, MOI will push toward 4 and below by late summer.
April 2026 vs May 2026
From April to May 2026, Markham sales surged 21.2% (250 to 303), while new listings dipped 2.6% (773 to 753). Average price jumped 5.2% month over month, the median climbed 7.0%, and SP/LP ticked up from 98% to 99%. SNLR rose from 35.9% to 37.4%.
| Metric | April 2026 | May 2026 | Change |
|---|---|---|---|
| Average Price | $1,140,668 | $1,199,667 | +5.2% |
| Median Price | $1,084,000 | $1,160,000 | +7.0% |
| Total Sales | 250 | 303 | +21.2% |
| New Listings | 773 | 753 | -2.6% |
| Active Listings | 1,109 | 1,166 | +5.1% |
| SNLR | 35.9% | 37.4% | +1.5 pts |
| Average Days on Market | 27 | 27 | 0 |
| SP/LP | 98% | 99% | +1 pt |
Source: TRREB Market Watch, May 2026 and April 2026
This is Markham’s strongest month-over-month gain in the past year, with sales up 21%, prices up 5%, and SP/LP returning to 99%. Notably, these gains occurred despite a decline in new listings. The increase in buyer activity this spring is not being matched by new supply. Sellers remain cautious, while buyers are becoming more active.
Spring momentum varies across York Region. Richmond Hill recorded 224 sales in May, up 47% year over year. Vaughan led with 313 sales, and Aurora had 71. Markham and Vaughan remain the region’s largest-volume markets, together representing over half of all regional sales.
For a full breakdown of the April numbers, check out our Markham April 2026 Market Update.