
By Shawn Zigelstein, Broker, Team Zold
Aurora’s market shifted in May. For the first time in over a year, the average sale-to-list price ratio reached 100%, meaning homes sold at their full asking price. Sales increased by 14.5%, and the median price rose year over year, indicating a notable change from recent months. However, the average price remains 6.3% lower than last May, so the recovery is not complete. Here is a closer look at the details.
How Did Aurora Real Estate Change Over the Past Year?
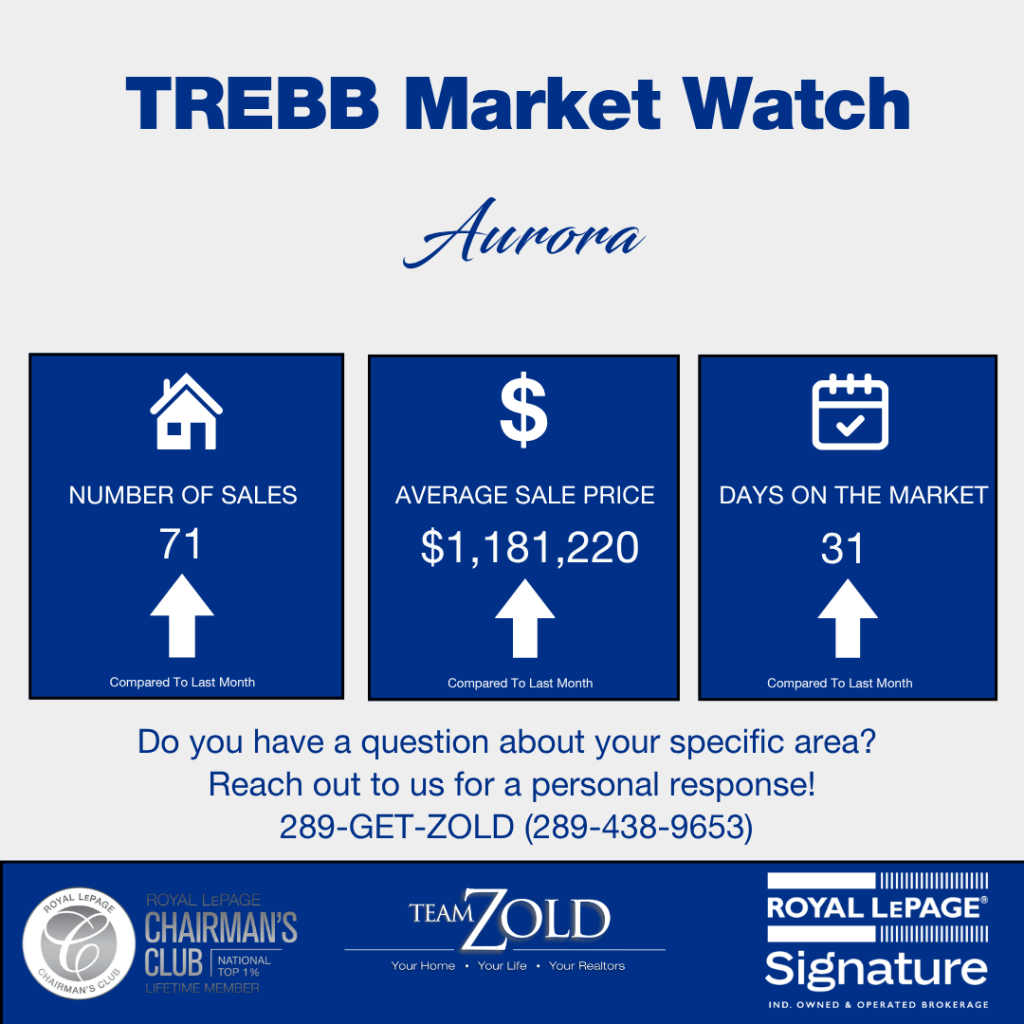
In May 2026, Aurora recorded 71 home sales, up 14.5% from 62 in May 2025, while the average sale price dropped to $1,181,220 (down 6.3% year over year). The median price, however, actually rose slightly to $1,145,000 from $1,135,000. The sale-to-list ratio improved from 97% to 100%, and new listings dropped 16.1% from 236 to 198.
| Metric | May 2025 | May 2026 | Change |
|---|---|---|---|
| Average Price | $1,260,556 | $1,181,220 | -6.3% |
| Median Price | $1,135,000 | $1,145,000 | +0.9% |
| Total Sales | 62 | 71 | +14.5% |
| New Listings | 236 | 198 | -16.1% |
| Active Listings | 317 | 301 | -5.0% |
| Months of Inventory | 4.0 | 5.3 | +1.3 mos |
| Average Days on Market | 27 | 31 | +4 days |
| SP/LP | 97% | 100% | +3 pts |
Source: TRREB Market Watch, May 2026
The focus is on the gap between average and median price movements. The average dropped by 6.3%, while the median rose by 0.9%. That tells you the typical Aurora home has held its value year over year. The average decline is being pulled down by mix — fewer high-end sales or a handful of transactions at the top of the market that softened the number. If you are buying or selling a home in the $1 to $1.3 million range, your market is essentially where it was a year ago in dollar terms, but with meaningfully better selling conditions.
The increase in the sale-to-list price (SP/LP) ratio from 97% to 100% is the clearest indicator of market change. Last year, buyers typically negotiated 3% below asking price. This May, that margin has disappeared. On a $1.2 million home, this represents $36,000 in lost negotiating room. Sellers who price accurately are achieving their asking price.
Fewer Listings, More Buyers
New listings declined 16.1% year over year, from 236 to 198. Active listings decreased 5.0%, from 317 to 301, while sales increased 14.5%. More buyers are now competing for fewer homes, which has driven the SP/LP ratio to 100%. The supply-demand balance has shifted in favor of sellers compared to last year, although months of inventory at 5.3 still technically indicate a buyer’s market.
What Happened by Property Type in Aurora This May?
Detached homes accounted for 44 of 71 total sales (62%) and achieved a 100% SP/LP ratio, selling at the asking price on average. Freehold townhouses recorded 11 sales with a 7.2% average price decline. Condo apartment prices increased 3.9% year over year, though this is based on only 6 sales.
Average Sold Price by Property Type
| Property Type | May 2025 | May 2026 | Change |
|---|---|---|---|
| Detached | $1,575,426 | $1,437,918 | -8.7% |
| Semi-Detached (3 sales) | $997,000 | $859,500 | -13.8% |
| Freehold Townhouse | $953,636 | $884,864 | -7.2% |
| Condo Townhouse (7 sales) | $1,019,000 | $625,500 | -38.6% |
| Condo Apartment (6 sales) | $627,125 | $651,283 | +3.9% |
Source: TRREB Market Watch, May 2026
Median Sold Price by Property Type
| Property Type | May 2025 | May 2026 | Change |
|---|---|---|---|
| Detached | $1,412,500 | $1,397,500 | -1.1% |
| Semi-Detached (3 sales) | $964,000 | $850,000 | -11.8% |
| Freehold Townhouse | $955,000 | $830,000 | -13.1% |
| Condo Townhouse (7 sales) | $1,025,000 | $675,000 | -34.1% |
| Condo Apartment (6 sales) | $585,000 | $530,500 | -9.3% |
Source: TRREB Market Watch, May 2026
Detached homes remain the key segment. The average price declined 8.7%, from $1,575,426 to $1,437,918, while the median decreased only 1.1%, from $1,412,500 to $1,397,500. This indicates that typical detached homes are maintaining their value. The average decline is due to fewer high-end transactions. With 44 sales at 100% SP/LP, detached homes currently offer sellers the most leverage. Buyers are not receiving discounts on well-priced detached properties.
Freehold townhouses experienced a 7.2% average price decline to $884,864, with 11 sales at a 98% SP/LP ratio. The median price fell 13.1% to $830,000, indicating increased activity in lower price brackets within this segment. This price point continues to attract buyers moving from detached homes, and sales volume remained stable year over year.
Condo townhouse prices declined 38.6% on average, but this figure should be interpreted with caution. With only 7 sales this May compared to 5 last May, a single atypical transaction can significantly affect the average. These results do not indicate a market-wide trend. The same applies to semi-detached homes with 3 sales and condo apartments with 6 sales; the sample sizes are too small for meaningful conclusions.
Aurora Market Trends Over the Past 12 Months
| Month | Average Price | Sales | SNLR | SP/LP |
|---|---|---|---|---|
| May 2026 | $1,181,220 | 71 | 32.5% | 100% |
| April 2026 | $1,153,153 | 60 | 31.4% | 97% |
| March 2026 | $1,187,555 | 51 | 31.6% | 98% |
| February 2026 | $1,229,261 | 40 | 30.5% | 98% |
| January 2026 | $1,238,516 | 31 | 30.1% | 96% |
| December 2025 | $1,248,524 | 41 | 30.1% | 96% |
| November 2025 | $1,285,894 | 50 | 30.3% | 97% |
| October 2025 | $1,317,466 | 62 | 31.5% | 96% |
| September 2025 | $1,183,116 | 69 | 32.7% | 98% |
| August 2025 | $1,358,974 | 55 | 32.2% | 96% |
| July 2025 | $1,481,109 | 47 | 32.3% | 95% |
| June 2025 | $1,329,557 | 59 | 33.6% | 98% |
Source: TRREB Market Watch, May 2026
The average price has fluctuated over the past 12 months, mainly because Aurora’s smaller market size means a few high- or low-value transactions can significantly impact the average. July 2025 saw the highest average at $1,481,109, while May 2026 was $1,181,220, representing a 20% swing driven by changes in sales mix as much as by actual market movement. The SP/LP trend provides a more reliable indicator.
The SP/LP ratio reached a low of 95% in July 2025 and has steadily increased since, reaching 100% in May 2026. This reflects a clear and sustained tightening of the market. Sellers have moved from routinely accepting 5% below asking to achieving full asking prices. This shift has developed gradually over the past year.
Sales volume supports this trend. It reached a low of 31 in January 2026, then increased to 40 in February, 51 in March, 60 in April, and 71 in May. May’s volume matches the highest level in the past 12 months, tied with September 2025. Buyer activity is not only recovering but accelerating.
April 2026 vs May 2026
| Metric | April 2026 | May 2026 | Change |
|---|---|---|---|
| Average Price | $1,153,153 | $1,181,220 | +2.4% |
| Median Price | $1,002,500 | $1,145,000 | +14.2% |
| Total Sales | 60 | 71 | +18.3% |
| New Listings | 200 | 198 | -1.0% |
| Active Listings | 296 | 301 | +1.7% |
| SP/LP | 97% | 100% | +3 pts |
| Average Days on Market | 26 | 31 | +5 days |
Source: TRREB Market Watch, May 2026
Month-over-month data shows clear acceleration. Sales increased 18.3% from April to May. The average price rose 2.4%, and the median increased 14.2%, from $1,002,500 to $1,145,000. This significant median increase reflects a shift toward higher-priced sales, likely more detached homes closing in May. The SP/LP ratio rose from 97% to 100%. Listing supply remained stable, so the momentum was driven by increased demand.
Days on market increased from 26 to 31, which may seem unexpected in a tightening market. This likely reflects older listings that sold in May after remaining on the market in April. The improvement in SP/LP is a more accurate indicator of current conditions, as homes listed in May sold closer to asking price than those listed in April.
Check out our Aurora April 2026 Market Update post for more information.
What This Means Heading into June
For Sellers
An SP/LP ratio of 100% is Aurora’s strongest result in over a year, indicating that the market rewards accurate pricing. It is essential to price your home correctly; in this market, overpricing does not lead to competitive offers. Homes listed at current market value are selling at full asking price, with little to no negotiation. Detached homes are especially well-positioned, with the highest SP/LP ratio and sales volume among all segments.
For Buyers
The negotiating window has narrowed significantly. Last year, an SP/LP ratio of 97% provided buyers with a 3% discount, or about $37,000 on a $1.2 million home. That opportunity has disappeared, especially for detached homes. However, prices remain lower than a year ago, particularly for detached properties (down 8.7% on average and 1.1% on median). Buyers are entering at a lower price point than last spring, even without additional discounts. The period of lower prices and weaker selling conditions is ending, and the trend is clearly upward.