
By Shawn Zigelstein, Broker and Team Leader, Team Zold · Royal LePage Signature Realty
Published September 2026
Markham's sales-to-new-listings ratio crossed 40%, the line TRREB uses to separate a buyer's market from a balanced one. It is the first municipality in York Region to get there, and it did not get there because of a sales surge. It got there because supply keeps thinning out while buyers keep showing up. That same pattern played out across the region at different speeds, pushing the overall SNLR to 35.8%, its eighth straight monthly increase.
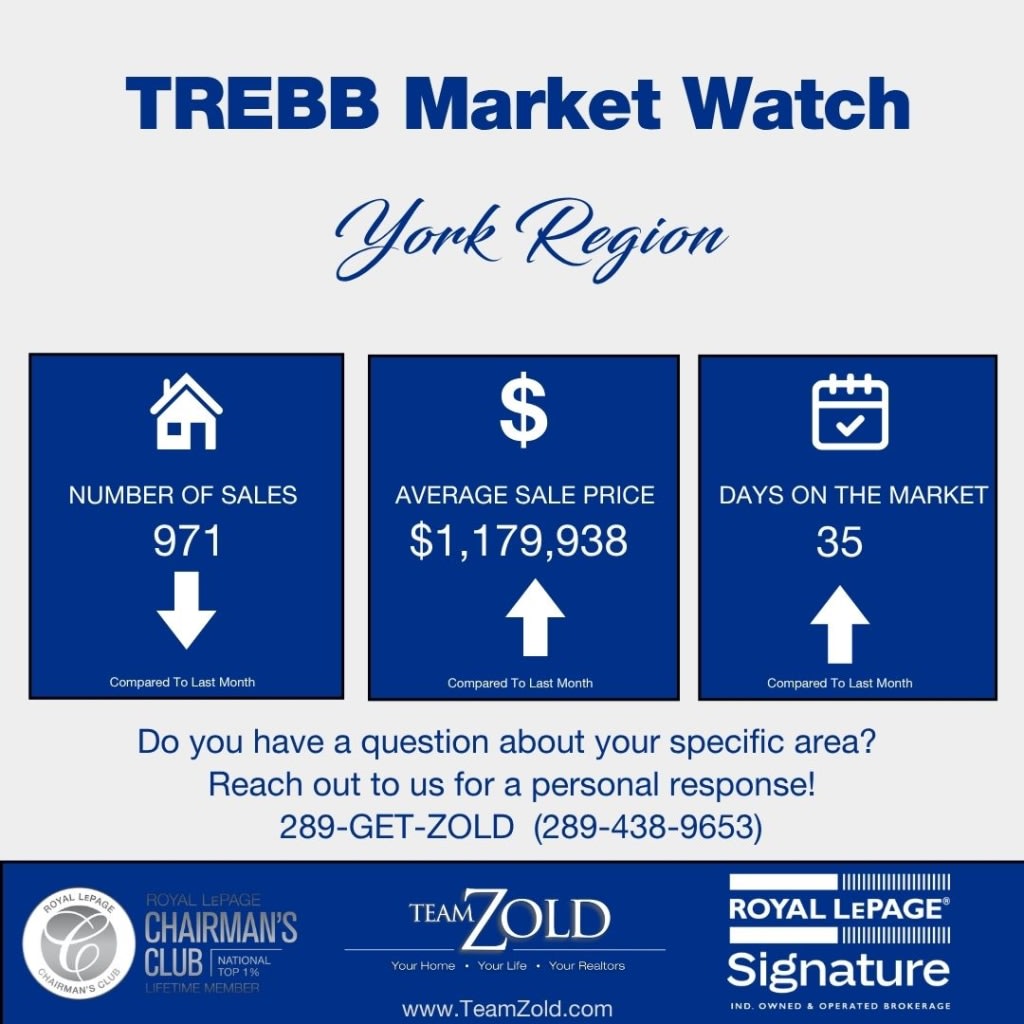
Prices, though, are a split screen. The average barely moved year over year, down just 0.4% to $1,179,938. The median fell 5.9% to $1,041,800. When the average holds and the median drops, you are looking at a market where the top end is carrying the math while the middle softens. That is the story across York Region right now, and the property-type breakdown makes it even clearer.
How Did York Region Real Estate Change Year Over Year in August 2026?
York Region recorded 971 sales in August 2026, down 2.3% from 994 in August 2025. The average price slipped 0.4% to $1,179,938 and the median fell 5.9% to $1,041,800. New listings dropped 8.5% to 2,389 and active inventory came down 8.6% to 4,919, which pushed the sales-to-new-listings ratio from 32.9% to 35.8%, a new twelve-month high. Days on market ticked down one day to 35, and the sale-to-list price ratio held flat at 97%.
| Metric | Aug 2026 | Aug 2025 | Change |
|---|---|---|---|
| Average Price | $1,179,938 | $1,184,196 | -0.4% |
| Median Price | $1,041,800 | $1,107,500 | -5.9% |
| Total Sales | 971 | 994 | -2.3% |
| New Listings | 2,389 | 2,611 | -8.5% |
| Active Listings | 4,919 | 5,382 | -8.6% |
| SNLR | 35.8% | 32.9% | +2.9 pts |
| Average Days on Market | 35 | 36 | -1 day |
| SP/LP Ratio | 97% | 97% | 0 |
Source: TRREB Market Watch, August 2026 and August 2025
The gap between average and median is the number I want you to focus on. The average dropped $4,258, while the median dropped $65,700. That is a 16-to-1 ratio, and it tells you that a market sitting at a 35.8% SNLR feels different than a market sitting at 32.9%. The direction matters more than the level, and the direction has been the same for eight months running.
York Region City by City: Where Buyers and Sellers Actually Stand in August 2026
With nine municipalities, the spread keeps getting wider. Markham crossed the 40% SNLR line that TRREB treats as the entrance to a balanced market. Meanwhile, King sits at 21.3% with 11.4 months of inventory, moving in the opposite direction from the rest of the region. Everyone else falls in between, but Markham's milestone sets a new benchmark.
What Has York Region Real Estate Done Over the Past 12 Months?
Eight consecutive months of a rising SNLR is not a blip. Every month since January, buyers have absorbed a slightly bigger share of what came to market. Prices have not responded yet, and that is normal. The order of operations in any tightening cycle is standard: volume firms up, inventory burns off, and price moves last. The average sitting about $55,000 below its October peak while the SNLR sits at a twelve-month high is what the middle of that sequence looks like.
| Month | Average Price | Sales | SNLR | MOI |
|---|---|---|---|---|
| August 2026 | $1,179,938 | 971 | 35.8% | 5.0 |
| July 2026 | $1,146,307 | 1,063 | 35.6% | 5.0 |
| June 2026 | $1,169,958 | 1,289 | 34.8% | 5.1 |
| May 2026 | $1,177,330 | 1,183 | 33.9% | 5.2 |
| April 2026 | $1,131,433 | 994 | 32.6% | 5.4 |
| March 2026 | $1,164,324 | 887 | 32.3% | 5.5 |
| February 2026 | $1,133,471 | 683 | 31.7% | 5.5 |
| January 2026 | $1,110,582 | 554 | 31.5% | 5.5 |
| December 2025 | $1,204,046 | 683 | 31.6% | 5.4 |
| November 2025 | $1,208,487 | 893 | 32.0% | 5.2 |
| October 2025 | $1,234,849 | 1,050 | 32.6% | 5.1 |
| September 2025 | $1,180,765 | 1,032 | 33.2% | 4.9 |
Source: TRREB Market Watch, September 2025 through August 2026
The sale-to-list ratio has spent the entire twelve months between 96% and 98%, never touching 100%. That negotiating window has now been open for over a year. What would close it is the SNLR pushing through 40% region-wide. At roughly half a point a month, that is still a few months away. But with Markham already across the line and Newmarket and Stouffville within two points, the front end of the region is already feeling the shift.
How Did York Region's August Compare to July 2026?
Sales eased 8.7% from July's 1,063 to 971, representing the normal late-summer slowdown. New listings fell 13.6% to 2,389. The average price rose 2.9% to $1,179,938 while the median slipped 1.7% to $1,041,800. The SNLR added another 0.2 points to reach 35.8%, and months of inventory held flat at 5.0.
| Metric | Jul 2026 | Aug 2026 | Change |
|---|---|---|---|
| Average Price | $1,146,307 | $1,179,938 | +2.9% |
| Median Price | $1,060,000 | $1,041,800 | -1.7% |
| Total Sales | 1,063 | 971 | -8.7% |
| New Listings | 2,764 | 2,389 | -13.6% |
| Active Listings | 5,179 | 4,919 | -5.0% |
| SNLR | 35.6% | 35.8% | +0.2 pts |
| Average Days on Market | 34 | 35 | +1 day |
| SP/LP Ratio | 98% | 97% | -1 pt |
Source: TRREB Market Watch, August 2026 and July 2026
August always cools off from the summer peak, so the sales dip is the least interesting line in this table. What matters is that the SNLR ticked up again in a slower month. New listings dropped faster than sales, which means the tightening did not pause for the August long weekend. The average rising while the median fell tells you about the mix of what sold: a higher concentration of detached closings relative to condos and townhouses pulled the average up, while the typical transaction came in slightly lower than July.
For a full breakdown of last month's numbers, take a look at our York Region July 2026 Market Update.
What This Means Heading into September 2026
What Should York Region Sellers Do Right Now?
The region-wide picture is shifting underneath the surface, but it's happening at different speeds depending on your municipality. If you are selling in the northern or eastern parts of the region like Markham, Newmarket, or Stouffville, inventory is compressing and buyer competition is starting to surface. If you are in King Township or Richmond Hill, the buyer's market conditions give purchasers more leverage. Wherever you are listed, a 97% sale-to-list ratio means pricing accurately to recent local comparable sales is essential. Do not price based on 2022 peak expectations; price to what is moving today.
Is This a Good Time to Buy in York Region?
Buyers still have plenty of leverage across most of York Region, with active inventory sitting near 5,000 listings and the sale-to-list ratio holding at 97%. However, the eight-month upward trend in the SNLR means the window of abundant choice is slowly narrowing. If you are looking in municipalities where supply is burning off faster—like Markham crossing into balanced territory—expect less room for aggressive negotiation as fall gets underway.
What to Watch in September 2026
Watch whether September's traditional post-Labor Day influx of new listings interrupts the region's eight-month tightening streak. If fresh supply floods the market faster than buyers can absorb it, the SNLR will stabilize or dip back down. If listings remain suppressed and the SNLR continues to climb toward 36% and beyond, more pockets of York Region will follow Markham across the balanced-market line before the year is out.