
Shawn Zigelstein, Broker | Team Zold, Royal LePage Signature Realty
Published September 2026
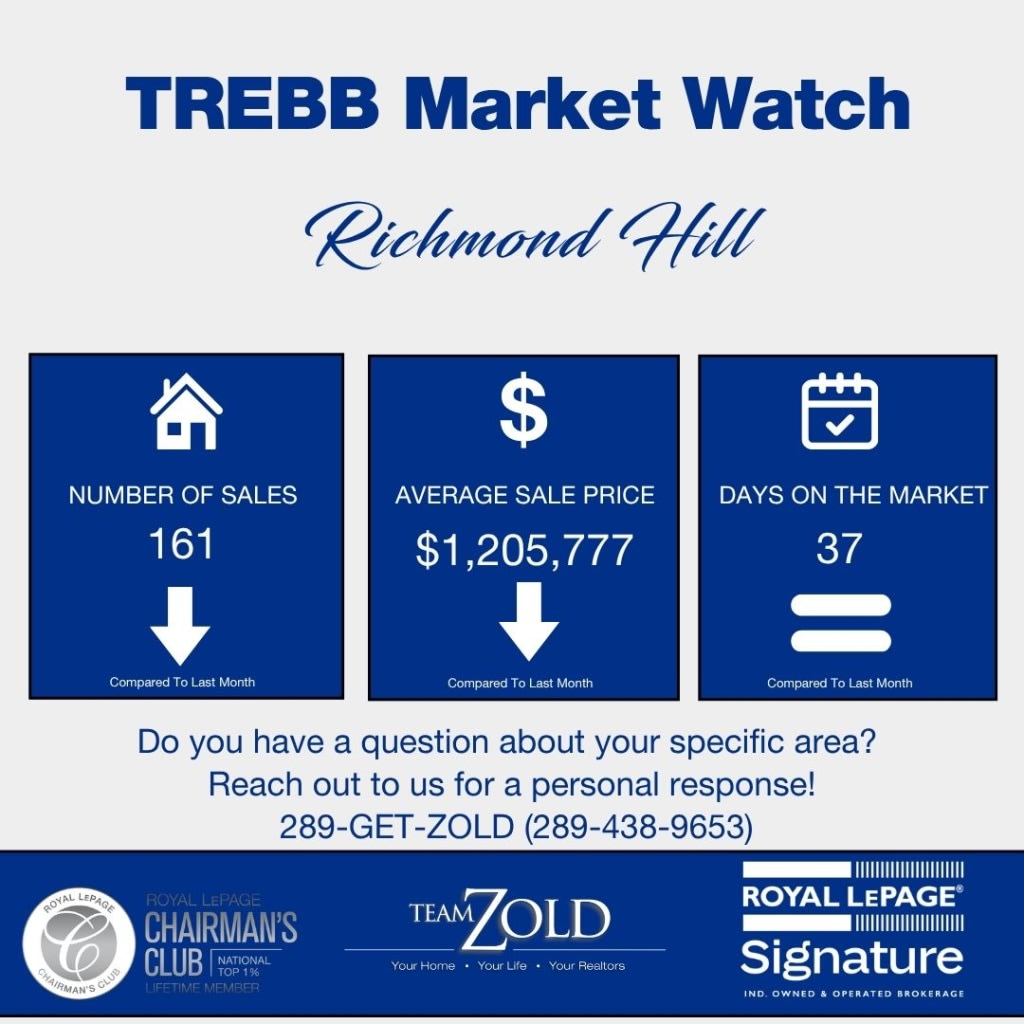
If you have been following the Richmond Hill real estate market this summer, the August numbers tell a story that every home buyer and seller needs to understand: active inventory is dropping fast, but buyers still hold the cards.
Active listings plunged 15.4% compared to last August—the sharpest drop in available homes anywhere in York Region. Under normal conditions, a drop in supply that steep would start pushing the market back toward sellers. But right now, it hasn't. Our Sales-to-New-Listings Ratio (SNLR) sat at 33.1%, keeping Richmond Hill firmly in buyer's market territory—well below the 40% threshold that signals a balanced market. On top of that, Months of Inventory (MOI) stayed locked at 5.6 months for the second straight month.
The headline numbers show an average sale price of $1,205,777 (down 3.3% year-over-year), but the median price dropped 8.3% to $1,068,888. When the average holds up better than the median, it usually means a handful of higher-priced sales are holding up the overall average while the bulk of everyday transactions are happening at lower price points. That is exactly what we are seeing across Richmond Hill right now.
How Did Richmond Hill Real Estate Change Year Over Year in August 2026?
Here is the full year-over-year breakdown across all property types in Richmond Hill:
| Metric | Aug 2026 | Aug 2025 | Change |
|---|---|---|---|
| Total Sales | 161 | 176 | -8.5% |
| Average Sale Price | $1,205,777 | $1,247,531 | -3.3% |
| Median Sale Price | $1,068,888 | $1,165,000 | -8.3% |
| New Listings | 449 | 499 | -10.0% |
| Active Listings | 933 | 1,103 | -15.4% |
| Sales-to-New-Listings Ratio (SNLR) | 33.1% | 30.3% | +2.8 pts |
| Months of Inventory (MOI) | 5.6 | 5.6 | 0.0 |
| Sale-to-List Price Ratio (SP/LP) | 97% | 98% | -1 pt |
| Listing Days on Market | 37 | 37 | 0 days |
Sales volume dropped 8.5% (from 176 down to 161), but new listings fell even faster at 10.0%. That is why the SNLR actually rose 2.8 percentage points despite fewer total transactions—fewer sellers putting up signboards is doing more to shift the ratio than actual buyer demand right now.
With a 97% sale-to-list price ratio and homes taking an average of 37 days to sell, sellers are accepting realistic offers below asking, and buyers aren't feeling rushed. That is a buyer's market in plain language.
What Happened by Property Type in Richmond Hill This August?
When you break down Richmond Hill by property segment, you see very different dynamics depending on what you're looking to buy or sell.
| Property Type | Sales | Aug 2026 Avg | YoY Avg Chg | Aug 2026 Median | YoY Med Chg | SP/LP |
|---|---|---|---|---|---|---|
| Detached | 74 | $1,667,913 | -1.5% | $1,482,500 | -3.4% | 97% |
| Semi-Detached | 6 | $1,040,000 | +9.7% | $1,025,000 | +7.9% | 102% |
| Freehold Townhouse | 38 | $1,030,927 | -8.0% | $1,026,350 | -10.8% | 98% |
| Condo Townhouse | 9 | $716,839 | -22.5% | $715,000 | -14.5% | 100% |
| Condo Apartment | 33 | $538,509 | -10.9% | $500,000 | -10.2% | 95% |
- Detached Homes: Making up the largest share of sales with 74 transactions, detached properties held up reasonably well. The average price dipped just 1.5% to $1,667,913, while the median slid 3.4% to $1,482,500. This remains the resilient core of Richmond Hill's market.
- Semi-Detached: While the average price shows a 9.7% jump, keep in mind this is based on only 6 sales. In a sample that small, one or two higher-priced sales can swing the average. However, the 102% sale-to-list ratio does show genuine competition for those few listings.
- Freehold Townhouses: With 38 sales, this segment gives us a reliable sample. Average prices fell 8.0% to $1,030,927 and the median dropped 10.8%. Buyers looking at freehold towns have real negotiating leverage right now.
- Condo Townhouses: Condo townhouses saw a steep price drop (-22.5% avg across 9 sales), which aligns with the broader condo softening in York Region.
- Condo Apartments: Condo apartments fell 10.9% to an average of $538,509, with a median landing at $500,000. At a 95% sale-to-list ratio, condo sellers are having the hardest time getting their asking price.
What Has Richmond Hill Real Estate Done Over the Past 12 Months?
Here is how Richmond Hill's market has tracked month-by-month over the past 12 months:
| Month | Avg Sale Price | Sales | SNLR | MOI |
|---|---|---|---|---|
| Aug 2026 | $1,205,777 | 161 | 33.1% | 5.6 |
| Jul 2026 | $1,222,748 | 182 | 33.1% | 5.6 |
| Jun 2026 | $1,241,949 | 230 | 32.6% | 5.7 |
| May 2026 | $1,209,257 | 224 | 31.3% | 5.9 |
| Apr 2026 | $1,175,275 | 184 | 29.7% | 6.2 |
| Mar 2026 | $1,219,863 | 159 | 29.3% | 6.3 |
| Feb 2026 | $1,166,816 | 121 | 28.7% | 6.4 |
| Jan 2026 | $1,285,799 | 98 | 28.6% | 6.4 |
| Dec 2025 | $1,220,811 | 114 | 28.6% | 6.3 |
| Nov 2025 | $1,255,877 | 163 | 29.7% | 6.0 |
| Oct 2025 | $1,334,199 | 175 | 29.9% | 5.8 |
| Sep 2025 | $1,324,741 | 188 | 30.8% | 5.6 |
The SNLR has climbed steadily from 28.6% in January up to 33.1% in August. While that shows clear direction, Richmond Hill remains one of the slower-recovering major markets in York Region alongside King. Months of inventory peaked at 6.4 in winter and has gradually eased to 5.6. Prices have moved sideways in a narrow band without a dramatic shift in either direction.
How Did Richmond Hill's August Compare to July 2026?
Comparing August directly to July shows the typical late-summer seasonal slowdown:
| Metric | Aug 2026 | Jul 2026 | Change |
|---|---|---|---|
| Total Sales | 161 | 182 | -11.5% |
| Average Sale Price | $1,205,777 | $1,222,748 | -1.4% |
| Median Sale Price | $1,068,888 | $1,150,000 | -7.1% |
| New Listings | 449 | 523 | -14.1% |
| Active Listings | 933 | 972 | -4.0% |
| SNLR | 33.1% | 33.1% | 0.0 pts |
| Months of Inventory (MOI) | 5.6 | 5.6 | 0.0 |
Sales dropped 11.5% and new listings fell 14.1%, which kept the SNLR and MOI locked at 33.1% and 5.6 respectively. The median price dropped 7.1% month-over-month, while the average only fell 1.4%, reinforcing that higher-end sales supported the average while the typical transaction occurred at a lower price point.
What This Means Heading into September 2026
For Sellers
Pricing accurately is critical. With a 97% sale-to-list ratio and 37 days on market, buyers are taking their time and negotiating. Even though active listings dropped 15.4%, there are still 933 active listings competing for 161 monthly sales—roughly six listings for every buyer. If you're selling in the $1M to $1.2M range, you are in the most active part of the market; pricing tightly to recent comparable sales will draw the largest pool of buyers.
For Buyers
You have time, selection, and leverage. An SNLR of 33.1% means roughly two out of every three new listings don't sell in their first month. You have room to be selective and negotiate conditional offers. Townhouse buyers are in a great position with average prices down 8.0%, and condo apartment buyers benefit from a 95% sale-to-list ratio. However, active listings are contracting—if you find a property that fits your needs at a fair price, holding out for deeper discounts is a diminishing strategy.
What to Watch
September will test whether the SNLR breaks above 33.1% after holding steady for two months. If new listings continue declining at a 10% to 14% pace, supply will tighten further. We will also watch whether the average-to-median price gap narrows, which would signal broader market stabilization.
Direct: 289-GET-ZOLD (289-438-9653)
Web: teamzold.com
Don't get sold, get Zold.