
By Shawn Zigelstein, Broker, Team Zold
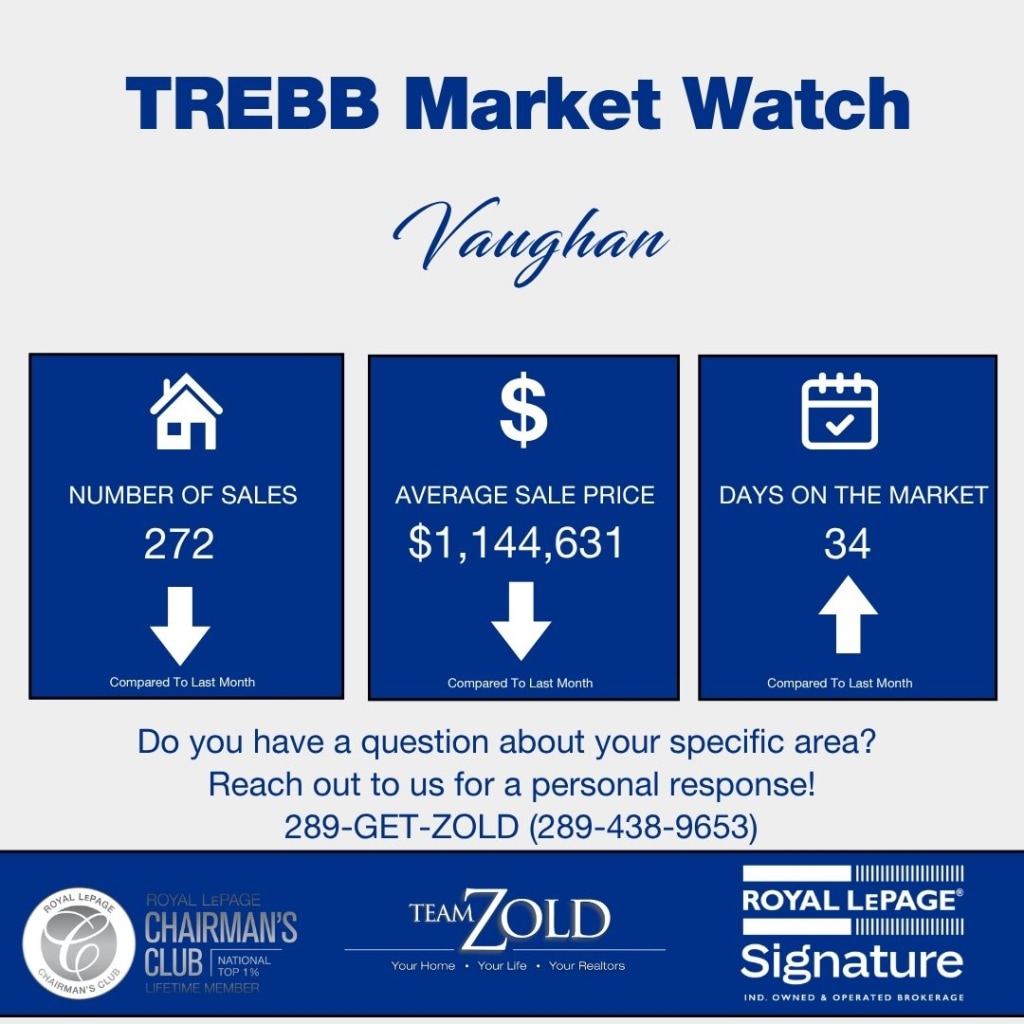
Last month I told you Vaughan's headline price decline was hiding a tightening market underneath. This month the price caught up with the truth and the tightening got louder. The average came in at $1,144,631, down 9% from last July, and this time that is a real decline, not a mix trick. At the same time, sellers staged a walkout: new listings fell 27.2% year over year, the sharpest pullback of any major market in York Region. Fewer homes, steady buyers, honest prices. That mix is worth understanding properly, so let's look at the numbers.
How Did Vaughan Real Estate Change Year Over Year in July 2026?
Vaughan recorded 272 sales in July 2026, up 1.9% from 267 in July 2025, second in York Region behind Markham. The average price fell 9.0% to $1,144,631 and the median fell 8.2% to $1,065,000. New listings dropped 27.2% to 647 and active inventory fell 14.2% to 1,277, which drove the SNLR from 32.2% up to 36.7%, a twelve-month high and a 4.5-point jump in a single year.
Here is the full year-over-year picture.
| Metric | July 2025 | July 2026 | Change |
|---|---|---|---|
| Average Price | $1,257,185 | $1,144,631 | -9.0% |
| Median Price | $1,160,000 | $1,065,000 | -8.2% |
| Total Sales | 267 | 272 | +1.9% |
| New Listings | 889 | 647 | -27.2% |
| Active Listings | 1,489 | 1,277 | -14.2% |
| SNLR | 32.2% | 36.7% | +4.5 pts |
| Average Days on Market | 30 | 34 | +4 days |
| SP/LP | 98% | 97% | -1 pt |
Source: TRREB Market Watch, July 2026 and July 2025
I owe you some context on that 9% before anyone panics. Last July was Vaughan's best pricing month of the entire past year, the average peaked at $1,257,185 and has not been back since. So July's year-over-year comparison is measured against the top of the market, which makes the drop read as steep as it possibly can. Against the past six months, July's average sits about 2% below where Vaughan has traded since February. This is a market that repriced through last fall and winter and has been holding its level since, not one that fell 9% recently.
And unlike last month, the average and median agree with each other, down 9.0% and 8.2%. When both move together, the change is broad-based rather than a quirk of which homes happened to sell. The typical Vaughan home now trades at $1,065,000. With a 97% sale-to-list ratio, that leaves roughly $32,000 between a typical asking price and the closing number. Buyers still have real room to work with here, more than in Markham or Richmond Hill, where the ratio has already climbed to 99%.
The Seller Walkout Is the Real Story
A 27.2% drop in new listings is not a rounding error, it is a statement. Vaughan sellers looked at soft prices and decided, in large numbers, that they would rather wait than negotiate. I have been calling this dynamic gridlock all year, and Vaughan is now its clearest example in the region: 242 fewer new listings this July than last, while buyers kept absorbing homes at last year's pace.
The math of that only goes one direction. Active inventory is down 14.2% year over year, the SNLR jumped four and a half points, and months of inventory sits at 4.9, level with last year despite all the price softness in between. Homes took 34 days to sell against 30 last July, so buyers are still deliberate. But every month sellers stay home while buyers keep showing up, the negotiating room that 97% ratio represents gets a little smaller.
What Happened by Property Type in Vaughan This July?
Detached homes did 124 sales at an average of $1,558,242, down 9.8% year over year, carrying the bulk of Vaughan's repricing. Freehold townhouses were the resilient segment, off just 6.5% on the average with 50 sales and a 99% sale-to-list ratio. Condo apartments logged 73 sales at an average of $599,113, down 6.3%, slipping below the $600,000 mark.
Average Sold Price by Property Type
| Property Type | July 2025 | July 2026 | Change |
|---|---|---|---|
| Detached (124 sales) | $1,727,941 | $1,558,242 | -9.8% |
| Semi-Detached (17 sales) | $1,085,778 | $1,002,929 | -7.6% |
| Freehold Townhouse (50 sales) | $1,085,340 | $1,014,970 | -6.5% |
| Condo Townhouse (8 sales) | $842,000 | $823,000 | -2.3% |
| Condo Apartment (73 sales) | $639,440 | $599,113 | -6.3% |
Source: TRREB Market Watch, July 2026
Median Sold Price by Property Type
| Property Type | July 2025 | July 2026 | Change |
|---|---|---|---|
| Detached (124 sales) | $1,544,000 | $1,392,500 | -9.8% |
| Semi-Detached (17 sales) | $1,077,500 | $975,000 | -9.5% |
| Freehold Townhouse (50 sales) | $1,082,000 | $998,000 | -7.8% |
| Condo Townhouse (8 sales) | $782,000 | $827,500 | +5.8% |
| Condo Apartment (73 sales) | $594,373 | $545,000 | -8.3% |
Source: TRREB Market Watch, July 2026
Detached is where the year's repricing shows up most clearly, down 9.8% on both the average and the median, which landed at $1,392,500. No mix illusion, both yardsticks agree. Two things keep this from being a distress story: detached homes still closed at 96% of asking in 29 days, the fastest of any Vaughan segment, and volume held at 124 sales, right where it was last July. Homes are trading, just at the market's new level. Sellers who accept that level are selling in a month. Sellers priced for last July are the ones sitting.
Freehold townhouses keep being the segment that will not bend. Off 6.5% on the average but closing at 99% of asking with 50 sales, up from 47 last year. This is the bracket where downsizers leaving big detached homes and first-time move-up families keep colliding, roughly $1,000,000 give or take, and that collision keeps the segment tight. If you own a Vaughan townhouse, you have the least to worry about of anyone in this article.
Condo apartments crossed a line this month worth saying out loud: the average dipped to $599,113. Down 6.3% from last July, 46 days to sell, 96% of asking, and the most negotiable segment in Vaughan. For a first-time buyer, a typical unit around the $545,000 median with roughly $22,000 of negotiating room is an entry price Vaughan has not offered in years. The caution flags are for sellers and investors: 208 new condo listings came to market against 73 sales, so this segment is nowhere near tightening the way freehold is.
The two small segments deserve their usual asterisk. Semis moved 17 homes and condo townhouses only 8, and at those volumes one estate sale or one renovated corner unit swings the whole column. The semi average falling 7.6% and condo townhouses printing 2.3% below last year are directional hints, not verdicts. Watch them over a quarter, not a month.
What Has Vaughan Real Estate Done Over the Past 12 Months?
The average price bottomed at $1,024,048 in January and has held between $1,140,000 and $1,190,000 for six straight months since, landing at $1,144,631 in July. The clearer trend is the SNLR: it sat at 31.5% in December, has risen every month of 2026, and just printed 36.7%, the highest reading in the window. Months of inventory has eased from 5.4 to 4.9.
| Month | Average Price | Sales | SNLR | MOI |
|---|---|---|---|---|
| July 2026 | $1,144,631 | 272 | 36.7% | 4.9 |
| June 2026 | $1,185,018 | 333 | 35.5% | 4.9 |
| May 2026 | $1,179,718 | 313 | 34.7% | 5.1 |
| April 2026 | $1,169,382 | 257 | 33.3% | 5.3 |
| March 2026 | $1,184,383 | 242 | 32.8% | 5.3 |
| February 2026 | $1,140,088 | 197 | 32.1% | 5.4 |
| January 2026 | $1,024,048 | 146 | 31.6% | 5.4 |
| December 2025 | $1,170,058 | 194 | 31.5% | 5.3 |
| November 2025 | $1,194,793 | 231 | 31.7% | 5.2 |
| October 2025 | $1,214,375 | 293 | 32.4% | 5.0 |
| September 2025 | $1,163,498 | 260 | 32.6% | 4.9 |
| August 2025 | $1,210,952 | 262 | 32.3% | 4.9 |
Source: TRREB Market Watch, August 2025 through July 2026
Look at the SNLR column and count: seven consecutive monthly increases, December through July, adding more than five points. That is the most sustained tightening streak of any market in York Region, and it happened while the price column stayed almost perfectly flat. This is the sequence I keep describing: demand stabilizes first, supply burns off second, prices move last. Vaughan has finished the first step, is deep into the second, and the third has not started. For buyers, that ordering is the entire opportunity: you are shopping at flat prices in a market whose leading indicators are all pointing up.
The sale-to-list ratio spent the whole year between 96% and 98%, so priced-right homes never stopped selling near asking, and the ratio has not touched 100% once in the twelve months shown above. What changes that is the SNLR reaching 40%, and at the pace of the past seven months, Vaughan crosses that line around the turn of the year. It does not have to happen, sellers could flood back in September and reset the ratio. But that is the trajectory as of today.
How Did Vaughan's July Compare to June 2026?
Sales eased 18.3% from June's 333, normal summer cadence, while new listings fell 24.2% to 647. The average price slipped 3.4% to $1,144,631 and the median came down 3.2% to $1,065,000. The SNLR still climbed 1.2 points to 36.7%, and days on market stretched from 28 to 34.
| Metric | June 2026 | July 2026 | Change |
|---|---|---|---|
| Average Price | $1,185,018 | $1,144,631 | -3.4% |
| Median Price | $1,100,000 | $1,065,000 | -3.2% |
| Total Sales | 333 | 272 | -18.3% |
| New Listings | 854 | 647 | -24.2% |
| Active Listings | 1,344 | 1,277 | -5.0% |
| SNLR | 35.5% | 36.7% | +1.2 pts |
| Average Days on Market | 28 | 34 | +6 days |
| SP/LP | 97% | 97% | 0 |
Source: TRREB Market Watch, July 2026 and June 2026
The line that matters is new listings falling 24% in a single month, twice as fast as sales fell. That is why the SNLR rose again in a cooling month, and it is the same pattern as the yearly picture compressed into thirty days: both sides of the market went quiet, sellers went quieter. The price dip of 3.4% month over month is partly mix: detached homes were 48.6% of June's sales and only 45.6% of July's, and when the priciest segment shrinks its share, the average follows.
Around the region, Markham held the volume lead at 288 with Vaughan's 272 next, and the two again did more than half of York Region's business. Vaughan's 36.7% SNLR has closed most of its gap with the region's tightest markets, remarkable for a market that spent last year stuck in the low 30s.
For a full breakdown of last month's numbers, take a look at our Vaughan June 2026 Market Update.
What This Means Heading into August 2026
What Should Vaughan Sellers Do Right Now?
The 27% listing drop is your competition disappearing, and it is the strongest argument for listing that Vaughan sellers have had in two years. A well-priced home in August faces the thinnest competition since 2023, ahead of a fall market that the SNLR trend says will be tighter still. The discipline part: price to July's closings, not last July's memories. The market's level is 8 to 9% below a year ago and buyers know it to the dollar. Detached sellers who price to the new level are closing in 29 days. The ones who price to 2025 are becoming someone else's negotiating comp.
Is This a Good Time to Buy in Vaughan?
Vaughan is offering the region's best combination of honest pricing and remaining leverage. The median is down 8.2%, the sale-to-list ratio at 97% leaves real room, condos just went on sale below $600,000, and days on market give you space for inspections and financing conditions. Here is the clock: the SNLR has climbed seven straight months, listings are shrinking, and the negotiating conditions you get today are measurably better than the ones the trend is pointing to for winter. If you are pre-approved and Vaughan is the plan, the second half of this year is when the plan should happen.
What to Watch in August 2026
First, the September listing flow. July's 27% drop could be sellers giving up for the summer or a longer strike, and the difference decides the fall market. If new listings come back at anything like normal levels, the tightening pauses and buyers keep their leverage into 2027. If they do not, Vaughan's supply cushion drains fast. Second, the condo floor: watch whether the average holds under $600,000 or bounces, because investors have been waiting on that signal. And third, the SNLR against 40%. At 36.7% and climbing better than half a point a month, the balanced-market line is inside the twelve-month window for the first time this cycle.