
By Shawn Zigelstein, Broker, Team Zold
Richmond Hill's July looks soft until you notice which side of the market softened more. Sales came in at 182, down 10.8% from last July. New listings fell 23.8%, more than twice as fast. And that lopsided cooling produced something that sounds impossible in a down month: the tightest supply picture Richmond Hill has had in a year, and homes closing at 99% of asking, tied for the highest ratio in York Region. Our home base is a strange market right now, and strange markets reward people who read them properly. So let's look at the numbers.
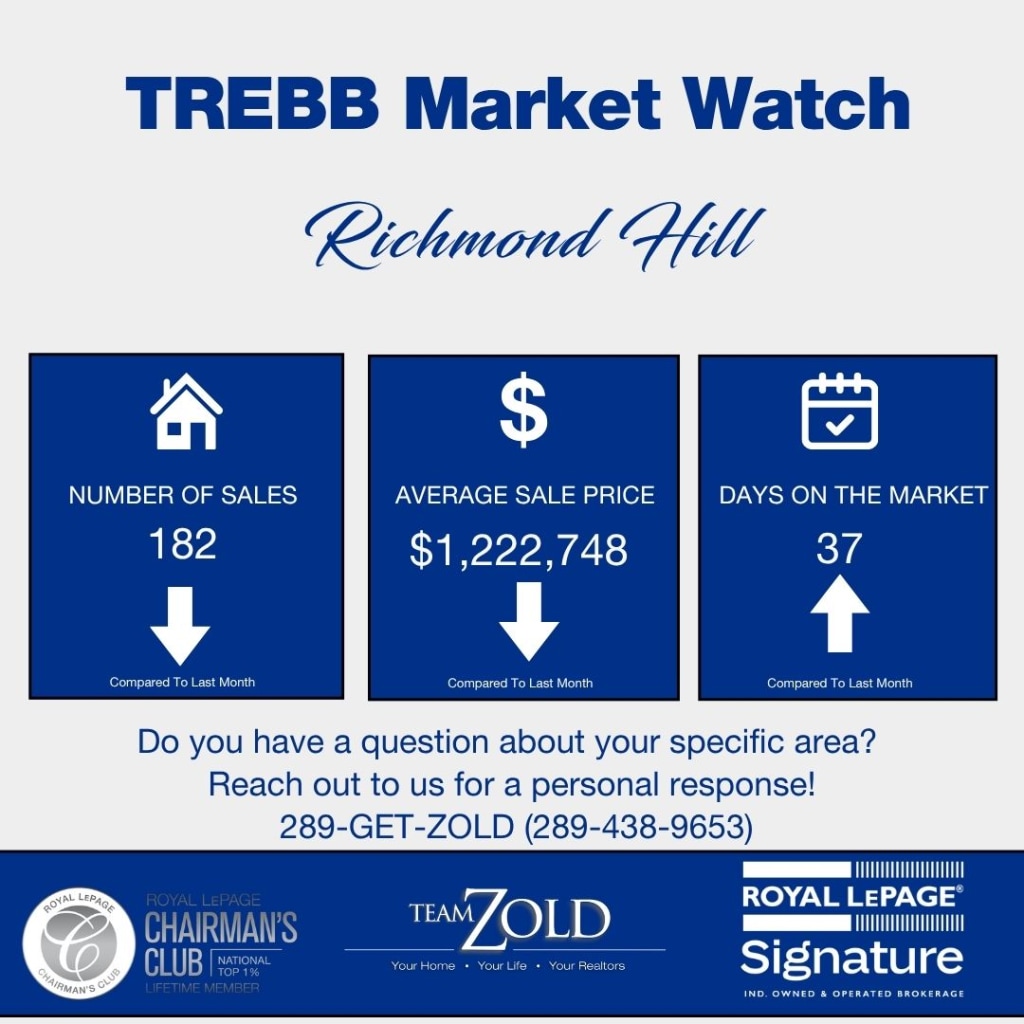
How Did Richmond Hill Real Estate Change Year Over Year in July 2026?
Richmond Hill recorded 182 sales in July 2026, down 10.8% from 204 in July 2025. The average price fell 7.8% to $1,222,748 and the median fell 6.3% to $1,150,000. New listings dropped 23.8% to 523 and active inventory fell 17.3% to 972, which lifted the SNLR from 30.4% to 33.1%, a twelve-month high, while the sale-to-list ratio rose a point to 99%.
Here is the full year-over-year picture.
| Metric | July 2025 | July 2026 | Change |
|---|---|---|---|
| Average Price | $1,325,820 | $1,222,748 | -7.8% |
| Median Price | $1,227,500 | $1,150,000 | -6.3% |
| Total Sales | 204 | 182 | -10.8% |
| New Listings | 686 | 523 | -23.8% |
| Active Listings | 1,175 | 972 | -17.3% |
| SNLR | 30.4% | 33.1% | +2.7 pts |
| Average Days on Market | 31 | 37 | +6 days |
| SP/LP | 98% | 99% | +1 pt |
Source: TRREB Market Watch, July 2026 and July 2025
The average fell further than the median again, 7.8% against 6.3%, and in Richmond Hill that gap is almost always about the luxury end. Our top tier, the $2 million-plus streets in South Richvale, Bayview Hill and the Observatory area, traded thin and slow this July, and every quiet month up there pulls the average down harder than it pulls the median. The typical Richmond Hill home changed hands at $1,150,000, about $77,000 less than a year ago. That is the real number to plan around.
Now hold that price softness up against the 99% sale-to-list ratio, because the two together describe this market better than either one alone. Prices are lower than last year, and yet homes that sell are closing within one percent of asking, roughly $11,000 on a median home. Both things are true because sellers here have repriced. The asking prices of homes that actually sold in July already reflected the market's new level, and buyers met them there. The 37 days on market tells you the other half: homes priced above the new level sat, and they are still sitting.
Fewer Buyers, Far Fewer Sellers
Sales falling 10.8% in a month when Markham rose 8.3% and Vaughan held flat deserves an honest look. Some of it is Richmond Hill's price point, the second-highest of the region's big markets, which keeps first-time buyers browsing next door. Some of it is our luxury tier hibernating. But the supply side is what changes the meaning of the month: sellers pulled back 23.8%, active inventory fell from 1,175 homes to 972, and months of inventory dropped from 6.4 last winter to 5.6 now.
A year ago Richmond Hill had the loosest market of the big four, and it still does, but the direction has turned. The SNLR bottomed at 28.6% around the turn of the year and has climbed to 33.1% since. When the region's softest big market starts tightening while its prices sit 6 to 8% below last year, that combination is what early-cycle looks like, not late-cycle.
What Happened by Property Type in Richmond Hill This July?
Detached homes did 97 sales at an average of $1,569,133, down 11.2% year over year, with the top end driving most of the decline. Semi-detached homes closed at 102% of asking and freehold townhouses at 101%, both over list. Condo apartments logged 33 sales, down a third from last July, at an average of $576,467.
Average Sold Price by Property Type
| Property Type | July 2025 | July 2026 | Change |
|---|---|---|---|
| Detached (97 sales) | $1,767,460 | $1,569,133 | -11.2% |
| Semi-Detached (14 sales) | $1,137,667 | $1,075,486 | -5.5% |
| Freehold Townhouse (24 sales) | $1,133,373 | $1,042,721 | -8.0% |
| Condo Townhouse (12 sales) | $813,500 | $753,914 | -7.3% |
| Condo Apartment (33 sales) | $641,552 | $576,467 | -10.1% |
Source: TRREB Market Watch, July 2026
Median Sold Price by Property Type
| Property Type | July 2025 | July 2026 | Change |
|---|---|---|---|
| Detached (97 sales) | $1,630,000 | $1,495,000 | -8.3% |
| Semi-Detached (14 sales) | $1,143,000 | $1,053,000 | -7.9% |
| Freehold Townhouse (24 sales) | $1,133,000 | $1,052,500 | -7.1% |
| Condo Townhouse (12 sales) | $775,000 | $674,438 | -13.0% |
| Condo Apartment (33 sales) | $645,000 | $550,000 | -14.7% |
Source: TRREB Market Watch, July 2026
Detached needs the average-versus-median treatment more than any segment in the city. The average dropped 11.2% while the median dropped 8.3% to $1,495,000, and that spread is the signature of a quiet luxury tier. A typical detached home in Richmond Hill still costs just under $1.5 million, sells in 33 days, and closes at 99% of asking. The $2 million-plus market is a separate animal right now: patient sellers, scarce buyers, long timelines. If you are selling in that tier, your comparable is not the city's detached median, it is the handful of recent closings on streets like yours, and pricing to anything else means months of sitting.
The middle of the market is flat-out competitive. Semis closed at 102% of asking, townhouses at 101%, and both medians held within 8% of last year. Everything in Richmond Hill between roughly $1,000,000 and $1,100,000 freehold is seeing the same collision we see across the region, downsizers and move-up buyers fighting over a thin supply of sensible homes. The 41-day townhouse figure looks slow next to that 101% ratio, and the explanation is the usual one: the well-priced ones sell over asking in a week, the ambitious ones supply the days-on-market average.
Condo apartments are Richmond Hill's outlier this month, and the honest read is muted demand. Sales fell from 50 to 33, the average slipped 10.1% to $576,467, and the median came down 14.7% to $550,000. The negotiating conditions are real, 97% of asking, 44 days to work with, but note that the semi and condo townhouse rows carry small-sample warnings, 14 and 12 sales, where one building or one estate sale moves the number. For an investor or a first-time buyer who wants Yonge Street access at the second-cheapest condo entry point among the region's major markets, this is the segment where you have time and leverage both.
What Has Richmond Hill Real Estate Done Over the Past 12 Months?
The average price has swung between $1,166,816 in February and $1,334,199 in October, closing July at $1,222,748. Sales bottomed at 98 in January, more than doubled to 230 by June, and stepped back to 182 in July. The SNLR sat below 30% for six straight months through the fall and winter and has climbed to 33.1%, while months of inventory fell from a peak of 6.4 to 5.6, the lowest in the twelve-month window.
| Month | Average Price | Sales | SNLR | MOI |
|---|---|---|---|---|
| July 2026 | $1,222,748 | 182 | 33.1% | 5.6 |
| June 2026 | $1,241,949 | 230 | 32.6% | 5.7 |
| May 2026 | $1,209,257 | 224 | 31.3% | 5.9 |
| April 2026 | $1,175,275 | 184 | 29.7% | 6.2 |
| March 2026 | $1,219,863 | 159 | 29.3% | 6.3 |
| February 2026 | $1,166,816 | 121 | 28.7% | 6.4 |
| January 2026 | $1,285,799 | 98 | 28.6% | 6.4 |
| December 2025 | $1,220,811 | 114 | 28.6% | 6.3 |
| November 2025 | $1,255,877 | 163 | 29.7% | 6.0 |
| October 2025 | $1,334,199 | 175 | 29.9% | 5.8 |
| September 2025 | $1,324,741 | 188 | 30.8% | 5.6 |
| August 2025 | $1,247,531 | 176 | 30.3% | 5.6 |
Source: TRREB Market Watch, August 2025 through July 2026
The turn is recent and it is visible. From last August through February, Richmond Hill's SNLR went sideways-to-down, bottoming twice at 28.6%, and months of inventory built to 6.4. Since March: five months of rising SNLR and falling inventory, ending at the tightest supply reading of the whole window. Richmond Hill entered this year as the big market where buyers had the most room, and it is exiting the summer as a market where that room is measurably shrinking, about eight tenths of a month of inventory gone since winter.
Prices have not followed yet. The July average sits about $111,000 below its October peak, and the sale-to-list ratio has stayed in a 96% to 99% band for the full year, never reaching 100%. Same sequence I have described in Vaughan and Markham, one step behind them: demand steadies, supply drains, price moves last. Richmond Hill is the market with the most inventory left to drain, which is exactly why its buyer window closes last.
How Did Richmond Hill's July Compare to June 2026?
Sales stepped down 20.9% from June's 230, in line with the summer slowdown across the region, while new listings fell 7.8% to 523. The average slipped 1.5% to $1,222,748, but the median rose 4.2% to $1,150,000. The SNLR added half a point to 33.1%, days on market moved from 31 to 37, and the sale-to-list ratio climbed two points to 99%.
| Metric | June 2026 | July 2026 | Change |
|---|---|---|---|
| Average Price | $1,241,949 | $1,222,748 | -1.5% |
| Median Price | $1,104,000 | $1,150,000 | +4.2% |
| Total Sales | 230 | 182 | -20.9% |
| New Listings | 567 | 523 | -7.8% |
| Active Listings | 1,009 | 972 | -3.7% |
| SNLR | 32.6% | 33.1% | +0.5 pts |
| Average Days on Market | 31 | 37 | +6 days |
| SP/LP | 97% | 99% | +2 pts |
Source: TRREB Market Watch, July 2026 and June 2026
A rising median and a falling average in the same month is the mix story running in reverse: July's sales skewed a little more toward mid-market homes and a little away from both extremes. The two-point jump in the sale-to-list ratio in a slower month is the more interesting line, it means July's sellers were priced tighter to market than June's, and buyers met them. Gridlock breaks one accurate listing at a time.
Regionally, the summer step-down hit everyone: York Region sales fell 17.5% month over month, Markham 20%, Vaughan 18%. Richmond Hill's 21% was the deepest of the big four, consistent with its higher price point and sleepy luxury tier, but its supply keeps tightening anyway.
For a full breakdown of last month's numbers, take a look at our Richmond Hill June 2026 Market Update.
What This Means Heading into August 2026
What Should Richmond Hill Sellers Do Right Now?
The 99% ratio is your proof that accurate pricing works here, and the 37 days on market is your proof of what happens without it. Price to the last ninety days of closings in your segment. If you are under $1.2 million, you are selling into genuinely tight conditions, semis and townhouses are closing over asking, and August's thin competition, with new listings down 24% year over year, is an advantage worth using before the fall crowd arrives. If you are above $2 million, be patient and price surgically, your buyer pool is thin and it is comparing you against every other estate that has sat since spring.
Is This a Good Time to Buy in Richmond Hill?
Richmond Hill is still the big market with the most room to negotiate, 5.6 months of inventory against Markham's 4.2, a median $77,000 below last July, and 37 days to do your homework. And the luxury tier is a genuine opportunity if you have been waiting to move up: $2 million-plus homes are sitting, sellers up there are negotiating, and you can take your time in a way that has not been possible since 2022. The trendline says do not confuse patience with unlimited time. Inventory is at a twelve-month low and the SNLR has risen five straight months. The best selection of this cycle is on the market right now.
What to Watch in August 2026
Watch the SNLR against the 35% mark. Richmond Hill at 33.1% is still comfortably a buyer's market, but it has added better than half a point a month since March, and 35% by fall would put it where Vaughan sat in the spring, one season from real tightness. Watch the fall listing flow just as closely: sellers held back 24% this July, and if September does not bring them back, Richmond Hill's famous inventory cushion deflates quickly. And keep one eye on the condo segment, if those 33 sales bounce back toward 50 in the fall, the last soft corner of this market starts firming up too.