
By Shawn Zigelstein, Broker, Team Zold
In the past month, 333 homes were sold in Vaughan, the highest monthly total in the past year and second only to Markham in York Region. This indicates a significant increase in demand. The average sale price was $1,185,018, reflecting a decrease of less than 3% compared to last June. While this suggests minimal change, the headline figure is influenced by the types of homes sold this month.
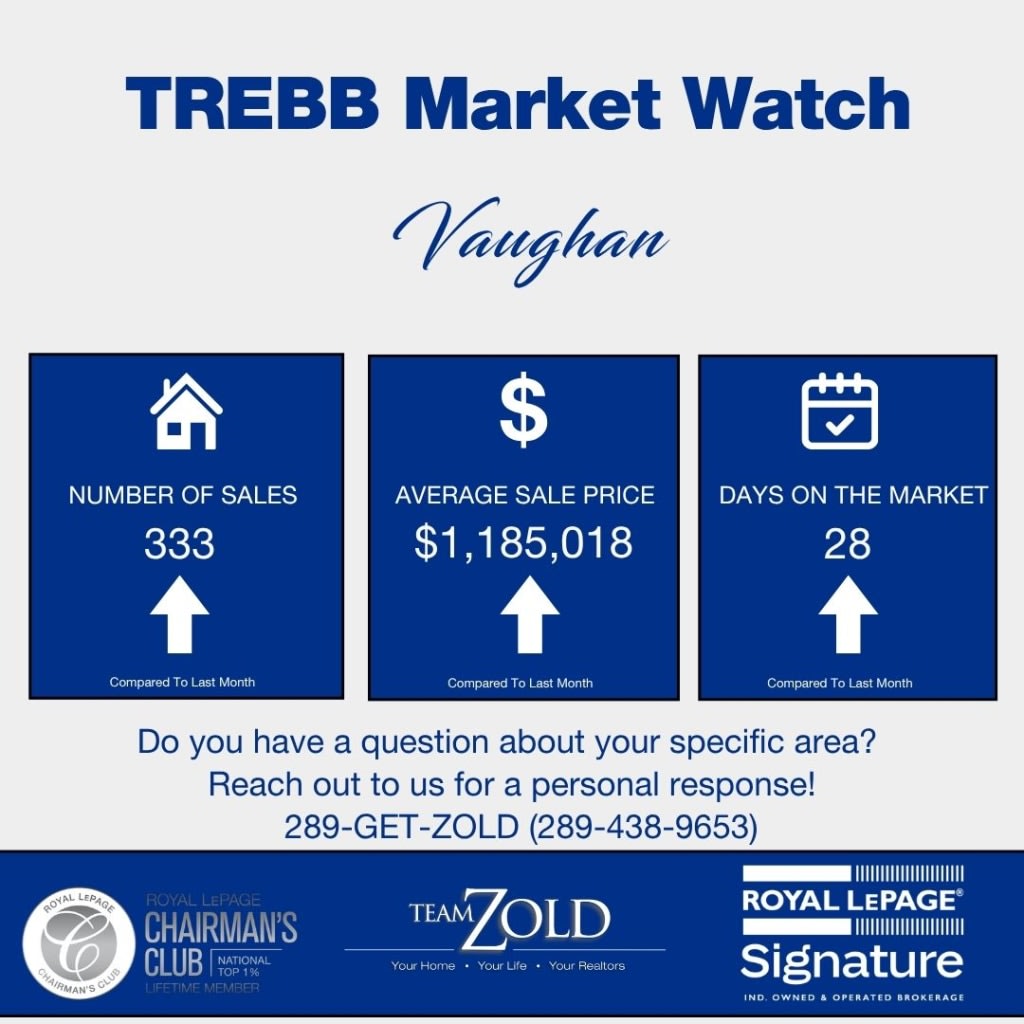
Let’s examine the details further.
How Did Vaughan Real Estate Change Year Over Year in June 2026?
Vaughan recorded 333 sales in June 2026, up 20.2% from the 277 that sold in June 2025. The average price slipped 2.9% to $1,185,018, and the median came down 4.5% to $1,100,000. New listings eased 5.0% to 854, and active inventory fell 13.5% to 1,344, which pushed the SNLR from 32.3% up to 35.5%, the highest reading Vaughan has posted in twelve months.
Here is the full year-over-year picture.
| Metric | June 2025 | June 2026 | Change |
|---|---|---|---|
| Average Price | $1,220,390 | $1,185,018 | -2.9% |
| Median Price | $1,152,000 | $1,100,000 | -4.5% |
| Total Sales | 277 | 333 | +20.2% |
| New Listings | 899 | 854 | -5.0% |
| Active Listings | 1,554 | 1,344 | -13.5% |
| SNLR | 32.3% | 35.5% | +3.2 pts |
| Average Days on Market | 29 | 28 | -1 day |
| SP/LP | 97% | 97% | 0 |
Source: TRREB Market Watch, June 2026
Start with the price, because the headline is going to get quoted to you and mislead you. Down 2.9% on average sounds like Vaughan held its ground this year. It did not, not really. What happened is that the mix of what sold tilted toward the top of the market. Detached homes were 47.3% of Vaughan's sales last June and 48.6% this June, while condo apartments shrank from 31.8% of sales down to 28.8%. When more of your volume comes from $1.6 million detached homes and less of it comes from $600,000 condos, the average holds up even when the homes themselves are worth less.
Strip that mix back out. Hold last June's blend of home types constant and apply this June's prices, and the decline works out closer to 4.5%. TRREB's own MLS Home Price Index, which adjusts for both the mix and the quality of home, puts Vaughan's benchmark at $1,132,200, down 5.97% year over year. So the real number is somewhere in the 5 to 6% range, not 3. Homes in Vaughan cost less than they did a year ago. The average is just hiding it behind a busier month at the high end.
This matters because of what you do with it. If you own a detached home, you have not lost only 3% of your value, and you have not lost the 12% a national headline might throw at you either. The truth sits in the middle, and it sits in your segment, which is the whole reason this article breaks the market apart by property type a little further down.
Demand Up, Supply Down
Here is the part the average is standing in front of. Supply is genuinely tightening. Active listings came down from 1,554 a year ago to 1,344, a 13.5% drop, and new listings eased 5% even in the busiest month of the year. More buyers walked in and they found less to choose from. The SNLR, which is the share of new listings that actually sell, climbed from 32.3% to 35.5%. That is the highest it has been in twelve months, and it has been grinding higher for months, not spiking for one. Vaughan spent most of the past year stuck in the low 30s. It is not stuck there anymore.
Vaughan's 333 sales trailed only Markham's 360 for the month, and the two of us together did more than half of York Region's 1,289 sales. Where Vaughan stands a little apart is inventory. Its 4.9 months of supply is looser than Markham's 4.3 but tighter than Richmond Hill's 5.7, and its SNLR lands right around the regional 34.8%. Vaughan is a big, broad market with many moving parts. Right now the parts are all pointing the same way: more buyers, fewer listings, and a slow squeeze on the room between them.
What Happened by Property Type in Vaughan This June?
Detached homes accounted for nearly half of Vaughan's volume, with 162 sales, up 24% from a year ago, and held their value better than anything else, down just 2.2% on average to $1,621,631. Freehold townhouses were the momentum story, with sales jumping 62% from 24 to 39. Condo apartments led the non-detached count at 96 sales but took the softest pricing, down 8.7% on average and the slowest of any segment to sell at 38 days.
Average Sold Price by Property Type
| Property Type | June 2025 | June 2026 | Change |
|---|---|---|---|
| Detached (162 sales) | $1,658,654 | $1,621,631 | -2.2% |
| Semi-Detached (18 sales) | $1,096,000 | $1,004,883 | -8.3% |
| Freehold Townhouse (39 sales) | $1,126,500 | $1,043,184 | -7.4% |
| Condo Townhouse (12 sales) | $905,089 | $771,175 | -14.8% |
| Condo Apartment (96 sales) | $662,164 | $604,412 | -8.7% |
Median Sold Price by Property Type
| Property Type | June 2025 | June 2026 | Change |
|---|---|---|---|
| Detached (162 sales) | $1,500,000 | $1,425,000 | -5.0% |
| Semi-Detached (18 sales) | $1,077,500 | $1,010,000 | -6.3% |
| Freehold Townhouse (39 sales) | $1,119,000 | $1,025,000 | -8.4% |
| Condo Townhouse (12 sales) | $867,500 | $760,000 | -12.4% |
| Condo Apartment (96 sales) | $600,000 | $549,444 | -8.4% |
Source: TRREB Market Watch, June 2026
A few things I want to pull out of these two tables.
Detached is the anchor, and it is holding. Down 2.2% on average and 5.0% on the median, with 162 sales and a sale-to-list ratio of 97%, and here is the part that matters most: it sold faster this June than last, 23 days versus 30. When the most expensive segment in a market accelerates while holding its price while volume climbs 24%, that segment is not in trouble. The typical detached home in Vaughan traded at $1,425,000 this June. A year ago it was $1,500,000. That is real movement, but it is a soft landing, not a fall.
Condo apartments are the other end of the story, and the opportunity end. The average came down by 8.7% to $604,412, and the median by 8.4% to $549,444, so buyers are getting a genuine discount here. They took 38 days to sell, the slowest of any segment, and the sale-to-list ratio sat at 96%, the softest in Vaughan. On a typical unit, that is roughly $22,000 of room below the asking price. This is the segment I have been pointing first-time buyers toward for a while now, and with 96 sales, the most of any non-detached type, it is clear more of them are acting on it. If you are selling a condo in Vaughan, understand that you are competing on both price and patience.
Freehold townhouses tell you something the price column on its own would miss. The average dropped 7.4% year over year, but the segment closed at exactly 100% of asking, and sales jumped from 24 to 39. A lower price, no room for negotiation, and a rush of buyers all at once is what a reset looks like once it hits its floor. Sellers here are not getting last year's number, but they are getting their number at full ask.
Two cautions on the small stuff. Semi-detached moved only 18 homes and condo townhouses only 12. At those volumes, a single unusual sale swings the average, so the 8.3% drop on semis and the 14.8% drop on condo townhouses are noisier than they look. For condo townhouses, the median, down 12.4%, is the steadier read. I would watch both of these segments across a few months rather than reading much into one June.
What Has Vaughan Real Estate Done Over the Past 12 Months?
Over the past twelve months, Vaughan's average price has followed a U-shaped pattern, peaking at $1,257,185 last July, bottoming at $1,024,048 in January 2026, and climbing back to $1,185,018 in June. The clearer signal is in the other columns. Sales rose from a January low of 146 to 333 in June, the highest in the window, while the SNLR pushed from the low 30s to 35.5% and the sale-to-list ratio held in a tight 96% to 98% band the entire way.
| Month | Average Price | Sales | SNLR | MOI |
|---|---|---|---|---|
| June 2026 | $1,185,018 | 333 | 35.5% | 4.9 |
| May 2026 | $1,179,718 | 313 | 34.7% | 5.1 |
| April 2026 | $1,169,382 | 257 | 33.3% | 5.3 |
| March 2026 | $1,184,383 | 242 | 32.8% | 5.3 |
| February 2026 | $1,140,088 | 197 | 32.1% | 5.4 |
| January 2026 | $1,024,048 | 146 | 31.6% | 5.4 |
| December 2025 | $1,170,058 | 194 | 31.5% | 5.3 |
| November 2025 | $1,194,793 | 231 | 31.7% | 5.2 |
| October 2025 | $1,214,375 | 293 | 32.4% | 5.0 |
| September 2025 | $1,163,498 | 260 | 32.6% | 4.9 |
| August 2025 | $1,210,952 | 262 | 32.3% | 4.9 |
| July 2025 | $1,257,185 | 267 | 32.2% | 4.9 |
Source: TRREB Market Watch, July 2025 through June 2026
Read the price column, and you see noise. Read the sales column, and you see a recovery. That gap is the whole reason this table is worth your time. Price bounces around from month to month because the mix of what sells keeps changing, exactly the way it did this June. Volume does not bounce like that; the signal moves first. Buyers come back, they clear the inventory, and only after that does pricing firm up. Vaughan is somewhere in the middle of that sequence right now, still about $72,000 below last July's peak on average, but with the demand side already back.
The SNLR is the cleanest piece of evidence for it. A year ago, Vaughan was running around 32%. It has worked its way up to 35.5%, and it has been climbing for months, not jumping. TRREB treats 40% as the floor of a balanced market, so Vaughan is not there, but the direction has not been in doubt since the winter. Months of inventory says the same thing more slowly, easing off its January and February peak of 5.4 back toward 4.9. None of it is loud on any single line. Line the months up in order, and it is very hard to miss.
How Did Vaughan's June Compare to May 2026?
Vaughan sales rose another 6.4% from May to June, from 313 to 333, keeping the climb going, while new listings ticked up 4.0% to 854. The average price edged up 0.4% to $1,185,018, and the median added 1.1% to $1,100,000. SNLR improved from 34.7% to 35.5%, and the sale-to-list ratio eased a point to 97%.
| Metric | May 2026 | June 2026 | Change |
|---|---|---|---|
| Average Price | $1,179,718 | $1,185,018 | +0.4% |
| Median Price | $1,088,000 | $1,100,000 | +1.1% |
| Total Sales | 313 | 333 | +6.4% |
| New Listings | 821 | 854 | +4.0% |
| Active Listings | 1,330 | 1,344 | +1.1% |
| SNLR | 34.7% | 35.5% | +0.8 pts |
| Average Days on Market | 27 | 28 | +1 day |
| SP/LP | 98% | 97% | -1 pt |
Source: TRREB Market Watch, June 2026 and May 2026
The month-over-month picture is quiet, and that is fine. June was never going to jump off of May the way May jumped off of April. What matters is that the direction did not stall. Sales added another 20 homes on top of an already strong May, and they did it while only 33 more listings came to market. Buyers are still clearing inventory faster than sellers are putting it back on the board, which is why active listings barely moved even in a month with more new product.
Across York Region, the same spring is landing at different speeds. Markham led with 360 sales and the tightest inventory in the region; Vaughan followed with 333; Richmond Hill managed 230 with a much looser 5.7 months of supply; and Aurora came in at 76. Vaughan sits right in the thick of the recovery, big and busy, with a little more inventory to work through than Markham, but a clear downward trend in that inventory.
For the full breakdown of last month's numbers, take a look at our Vaughan May 2026 Market Update.
What This Means Heading into July 2026
Sellers:
You are selling into the strongest demand Vaughan has had in a year, with 13% less competing inventory than last June. That is a good position to be in. It is not a blank cheque. The sale-to-list ratio is 97%; the SNLR is 35.5% and not yet 40%; and homes are still taking 28 days to move, so buyers have not lost their footing. Price to what the last three comparable homes actually closed at, not to the "prices only fell 3%" headline, because that headline is a trick and the buyers touring your home already know it. Detached above $1.6 million and condos are the two places where accurate pricing matters most, for opposite reasons. One has a thin ceiling. The other has thick competition.
Buyers:
For the right segment, yes, and the discount is bigger than the headline lets on. TRREB's price index has Vaughan homes down about 6% year over year on a like-for-like basis, which on a typical home works out closer to $68,000 than the $35,000 the raw average suggests. The room is widest in condo apartments, where the sale-to-list ratio is 96%, and homes sit 38 days, which buys you time to inspect, time to think, and time to negotiate. Just read the trend before you wait too long. Sales are at a twelve-month high, inventory is falling, and the SNLR has climbed for months. The exact conditions that opened this window- plenty of supply and cautious buyers are the conditions that are quietly closing it.