Richmond Hill’s housing market is still favouring buyers in March 2026, but activity may be starting to pick up as spring approaches. Listings have gone down, yet sales are up 8.9% compared to last year. The average selling price has barely changed, rising just 0.4%, while the median price has dropped by 5.6%. Let’s look at the numbers to understand what’s happening.
Here is the latest May 2026 Richmond Hill Market Update post.
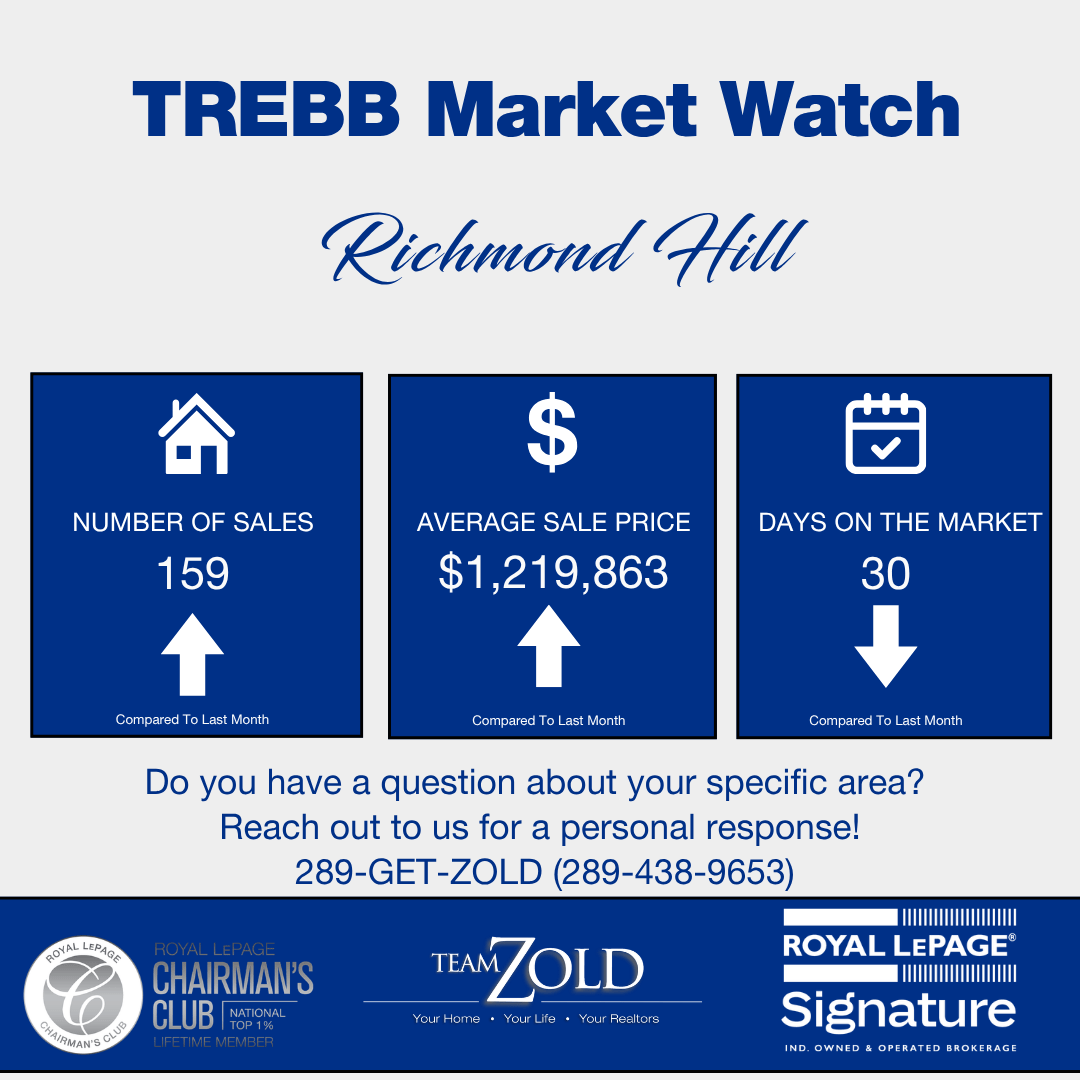
March 2026 vs March 2025
Metric | March 2026 | March 2025 | Change |
| Average Price | $1,214,567 | $1,219,863 | 0.4% |
| Median Price | $1,187,000 | $1,120,000 | -5.6% |
| Total Sales | 146 | 159 | 8.9% |
| New Listings | 617 | 533 | 19.8% |
| Active Listings | 927 | 848 | -8.5% |
| SNLR | 32.8% | 29.3% | -3.5 |
| Average Days on Market | 22 | 30 | + 8 days |
| SP/LP | 101% | 98% | -3 |
Source: TRREB Market Watch, March 2026.
The average home price has barely changed, up just 0.4%, while the median price fell 5.6%, from $1,187,000 in March 2025 to $1,120,000 in March 2026. That’s a $67,000 decrease. This suggests that a few expensive sales are raising the average, while the median shows the middle of the market has softened. The median better reflects what most buyers are paying right now.
Homes Are Taking Longer to Sell and Going for Less
The data shows that the average time a property spends on the market has increased from 22 to 30 days, a 36% jump. The sale-to-list price ratio also dropped from 101% to 98%. This means homes are taking longer to sell and sellers are accepting offers below their asking price. Buyers now have more time to do their research and negotiate, which is good news for families or anyone planning to move to Richmond Hill.
By Property Type: Average Sold Price
Property Type | March 2025 | March 2026 | Change |
| Detached | $1,756,286 | $1,641,523 | -6.5% |
| Semi-Detached | $1,182,750 | $1,127,700 | -4.7% |
| Freehold Townhouse | $1,192,245 | $1,068,238 | -10.4% |
| Condo Townhouse | $879,375 | $764,799 | -13.0% |
| Condo Apartment | $599,929 | $579,492 | -3.4% |
Source: TRREB Market Watch, March 2026.
By Property Type: Median Sold Price
Property Type | March 2025 | March 2026 | Change |
| Detached | $1,673,000 | $1,488,000 | -11.1% |
| Semi-Detached | $1,131,500 | $1,107,750 | -2.1% |
| Freehold Townhouse | $1,185,250 | $1,070,750 | -9.7% |
| Condo townhouse | $887,000 | $665,000 | -25.0% |
| Condo Apartment | $574,000 | $587,500 | +2.4% |
Source: TRREB Market Watch, March 2026.
Condo townhouses have seen the biggest drop among property types. The median selling price fell 25%, from $887,000 last March to $665,000 this March. With a sale-to-list price ratio of 95% and an average of 33 days on the market, buyers have a lot of leverage right now.
Richmond Hill Price Trend Over The Past Year
Month | Average Price | Sales | SNLR | MOI |
| March 2026 | $1,219,863 | 159 | 29.3% | 6.3 |
| February 2026 | $1,166,816 | 121 | 28.7% | 6.4 |
| January 2026 | $1,285,799 | 98 | 28.6% | 6.4 |
| December 2025 | $1,220,811 | 114 | 28.6% | 6.3 |
| November 2025 | $1,255,877 | 163 | 29.7% | 6.0 |
| October 2025 | $1,334,199 | 175 | 29.9% | 5.8 |
| September 2025 | $1,324,741 | 188 | 30.8% | 5.6 |
| August 2025 | $1,247,531 | 176 | 30.3% | 5.6 |
| July 2025 | $1,325,820 | 204 | 30.4% | 5.5 |
| June 2025 | $1,313,482 | 174 | 30.4% | 5.4 |
| May 2025 | $1,478,294 | 152 | 30.4% | 5.3 |
| April 2025 | $1,302,226 | 155 | 32.1% | 4.9 |
| March 2025 | $1,214,567 | 146 | 32.8% | 4.7 |
Source: TRREB Market Watch, March 2026.
Over the past year, the market reached its highest point in May, with the average home selling for $1,478,294. After that, prices dropped and have remained steady, ranging between $ 1.17M and $1.3M.
SP/LP has been below 100% since August 2025:
Since August, the SP/LP ratio has stayed below 100%, dropping to 96% around December and January. It has since climbed back to 98%, but remains under 100%. This means sellers have accepted offers below their asking price for eight months in a row.
For buyers looking in Richmond Hill, this is a good opportunity to negotiate on price, which was not possible a year ago when sellers were getting more than their asking price on average.
What This Means Heading into April
For Sellers:
For sellers, the numbers are starting to look better. The SP/LP ratio has gone up from 96% in January to 98% in March. Sales volume is rising, and the average days on market have dropped from 51 to 30 since January.
For buyers:
Buyers have the advantage at the moment. With 6.3 months of inventory and an SNLR of 29.3%, most properties are not seeing multiple offers, so you can negotiate on price and take your time finding the right home for you and your family. Sales in March 2026 are up 62% from January, indicating the market is getting busier as the weather warms up. If you have been waiting, now is a great time to buy a home in this area.
What to Look For in April
April and May are usually the busiest months in the GTA. If the SNLR goes above 30% and inventory drops below 6 months, that would be an early sign that the market is moving toward balance. If these numbers stay the same, the buyer’s market will likely continue through spring. The data from March suggests we are closer to the bottom of the market than to further declines, but this is just a trend, not a guarantee.